Table of contents
The Multidimensional Poverty Index (MPI) is a measure of poverty that takes into account multiple dimensions of deprivation, such as health, education, and standard of living.
Global MPI
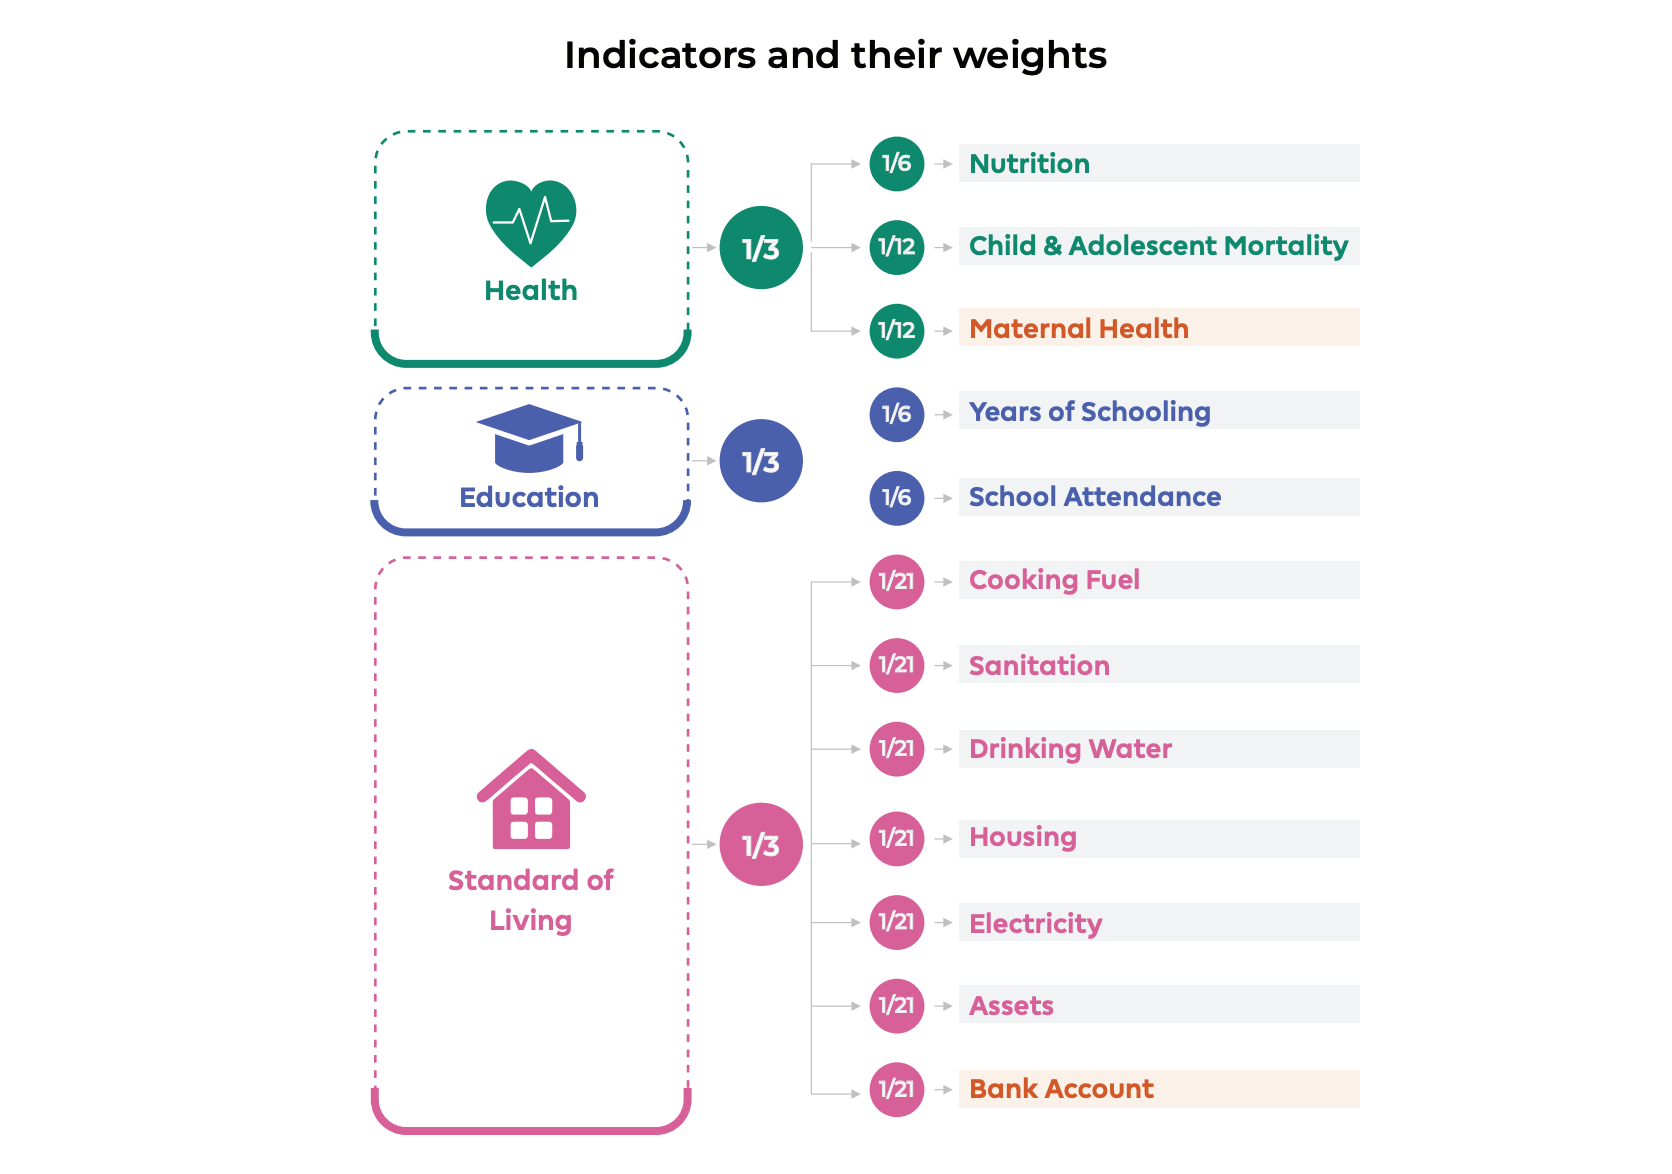
The Global MPI uses 10 indicators covering three main areas:
- Health
- Education
- Standard of living
These three dimensions have one-third weight each in the final index.

The global MPI Report is jointly published by the Oxford Poverty and Human Development Initiative (OPHI) and the United Nations Development Programme (UNDP).
- It advances SDG 1 – ending poverty in all its forms everywhere.
- It also measures interconnected deprivations across indicators related to SDGs 1, 2, 3, 4, 6, 7 and 11.
2030 Agenda
- Addresses Sustainable Development and the 17 SDGs related to the economic, environmental, and social aspects of societal well-being and are focused on the core principle of “leaving no one behind.”
According to the Global Multidimensional Poverty Index 2021, India's MPI has declined from 54.7% in 2019 to 49.9% in 2021, indicating a reduction in the number of people living in multidimensional poverty.
This means that India has made progress in improving access to basic services such as healthcare, education, and sanitation, which are essential for inclusive growth.
India: National MPI
The Indian MPI by NITI Aayog has two additional indicators:
- Maternal health (under the health dimension)
- Bank accounts (under the standard of living dimension)
This has been done, according to the NITI Aayog, to align the MPI with India’s national priorities.
What is the National Multidimensional Poverty Index?
- About
- NITI Aayog, as the nodal agency for MPI, has been responsible for constructing an indigenised index for monitoring the performance of States and Union Territories (UTs) in addressing multidimensional poverty.
- In order to institutionalise this, NITI Aayog constituted an inter-ministerial MPI Coordination Committee (MPICC) including Ministries and departments pertaining to areas such as health, education, nutrition, rural development, drinking water, sanitation, electricity, and urban development, among others.
- MPI Coordination Committee (MPICC)
- The National MPI uses NFHS data, which is conducted by the International Institute for Population Sciences (IIPS) under the aegis of the Ministry of Health and Family Welfare (MoHFW).
- The committee also included experts from the Ministry of Statistics and Programme Implementation (MoSPI) and technical partners – OPHI and UNDP.
- The latest iteration of national MPI is based on the NFHS-5 conducted through 2019-21 and is comparable with the baseline statistics of the national MPI computed using the data from the NFHS-4 conducted through 2015-16.
- The data for both the surveys are representative at national, state and district levels.
We can't clear UPSC for you.
But with our personalised mentor support, you'll be ready to do it yourself.
How is MPI calculated?
According to the MPI method -
If a person is deprived in a third or more of 10 (weighted) indicators, they are identified as “MPI poor”.
However, to calculate the index value, three separate calculations are needed.
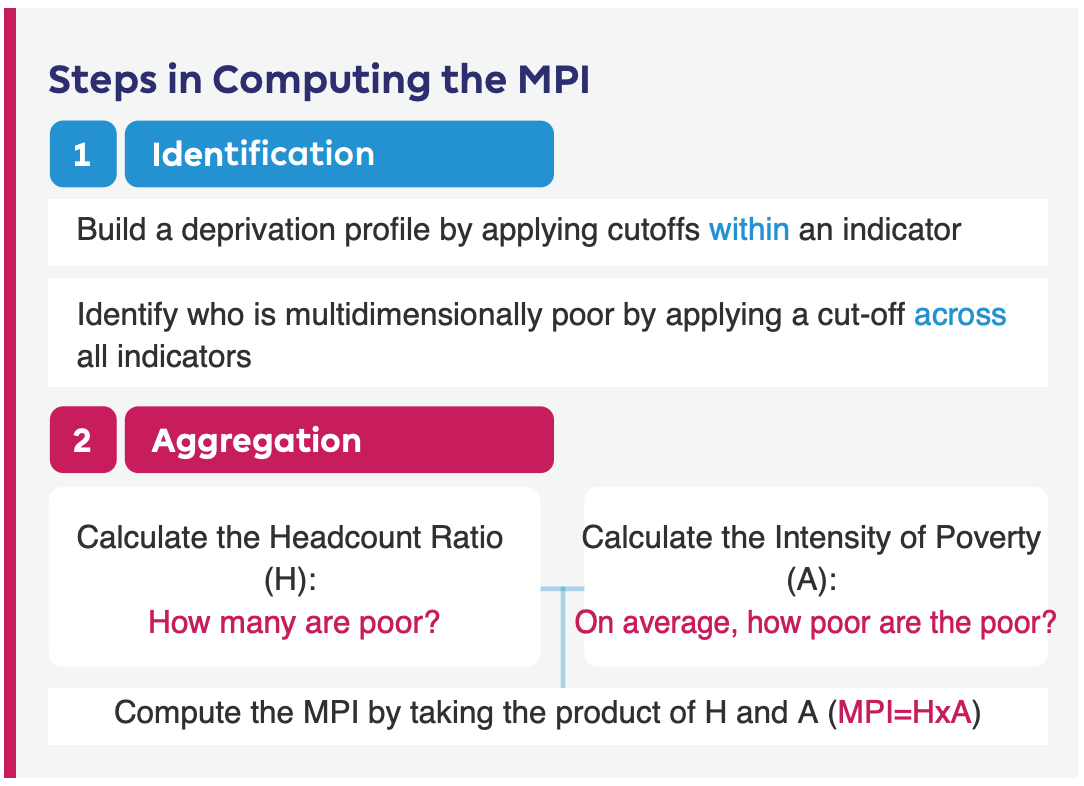
Headcount Ratio (H)
- Finding out the “incidence of multidimensional poverty” (denoted by the symbol H)
- The incidence essentially refers to the proportion of multidimensionally poor in the population
- It is arrived at by dividing the number of multidimensionally poor persons by total population.
- More simply, it answers the question: How many are poor?
Intensity (A)
- The second calculation involves finding out the “intensity” of poverty (it is demoted by the symbol A).
- This answers the question: How poor are they?
More technically, this refers to the average proportion of deprivation that is experienced by multidimensionally poor individuals. To compute intensity, the weighted deprivation scores of all poor people are summed and then divided by the total number of poor people.
MPI
- Finally, the MPI is arrived at by multiplying the incidence of multidimensional poverty (H) and the intensity of poverty (A).
Here is a sample data set for you,
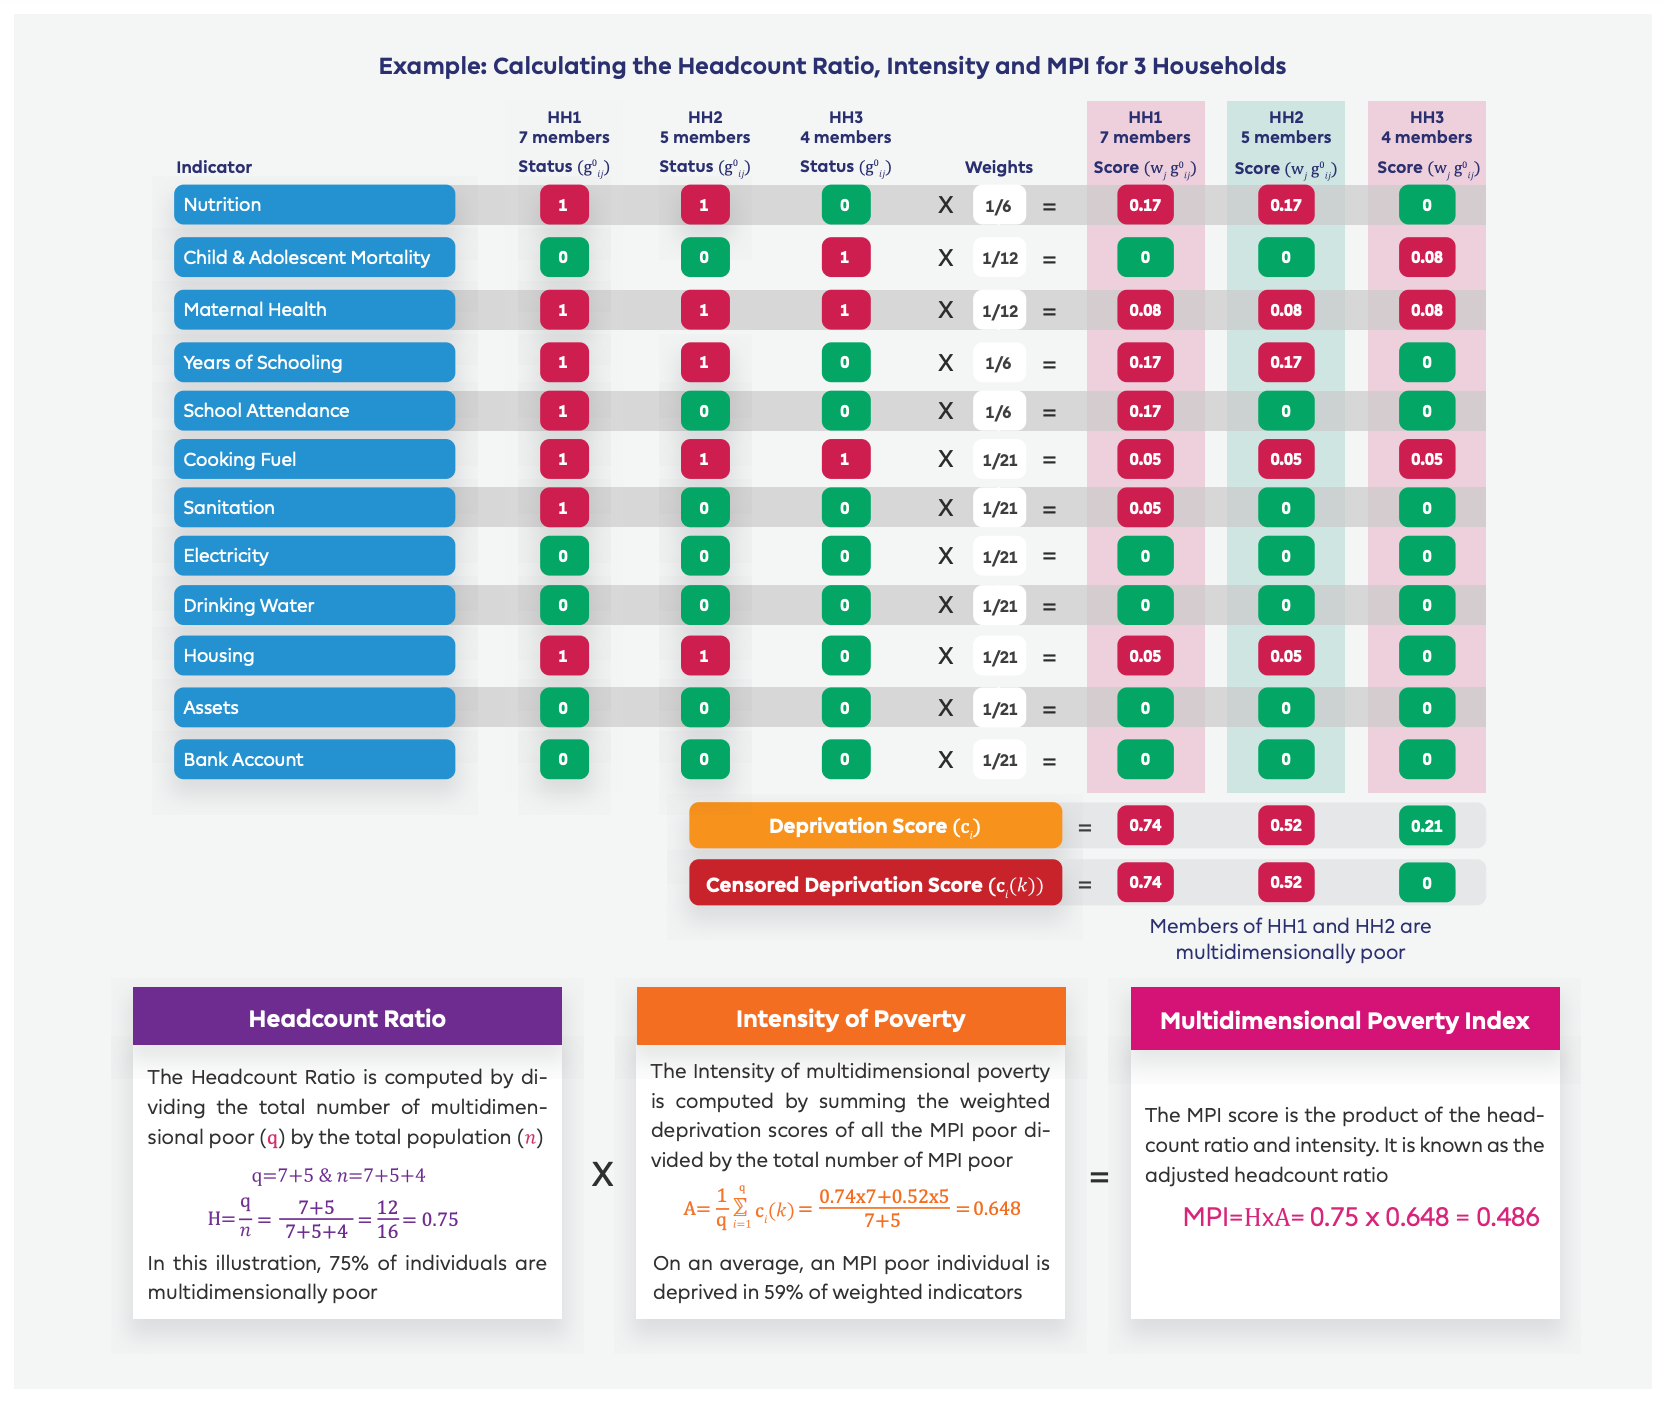
The MPI value for a given population, therefore, is the share of weighted deprivations faced by multidimensionally poor individuals divided by the total population.
Significance of the Multidimensional Poverty Index
- MPI helps create a complete picture of poverty by identifying who is poor and how they are poor.
- It allows for comparisons between countries and regions and within countries among different groups, such as urban and rural areas.
- MPI is flexible and can be adapted to different contexts, maintaining transparency in identifying the poor.
- It helps prioritize efforts to target the most vulnerable, works at different levels (individual, agency, community), and allows for comparisons against specific cutoffs in each dimension.
- MPI simplifies measurements by breaking them down into dimensions to identify the main contributors to multidimensional poverty.
National MPI Progress Report 2023 - NITI Aayog
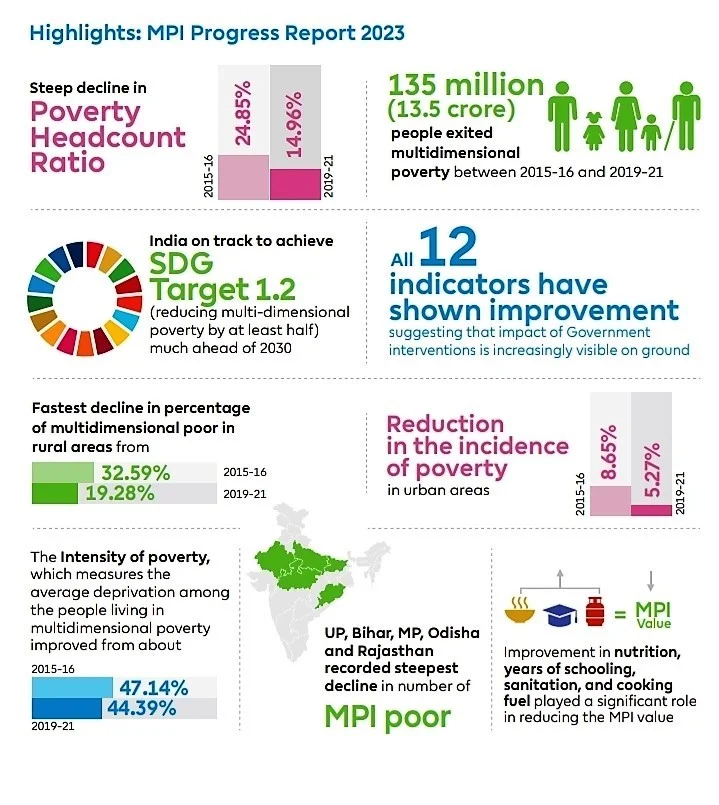
India aims to reduce poverty in all its forms by at least half by 2030 (SDG target 1.2). To measure India’s progress in this respect, NITI Aayog has developed an indigenised index to monitor and address multidimensional poverty. The baseline edition of national multidimensional poverty index was launched in 2021.
This present second edition of National MPI has been developed based on National Family Health Survey-5 (NFHS-5).
Regional/State-wise distribution: MPI
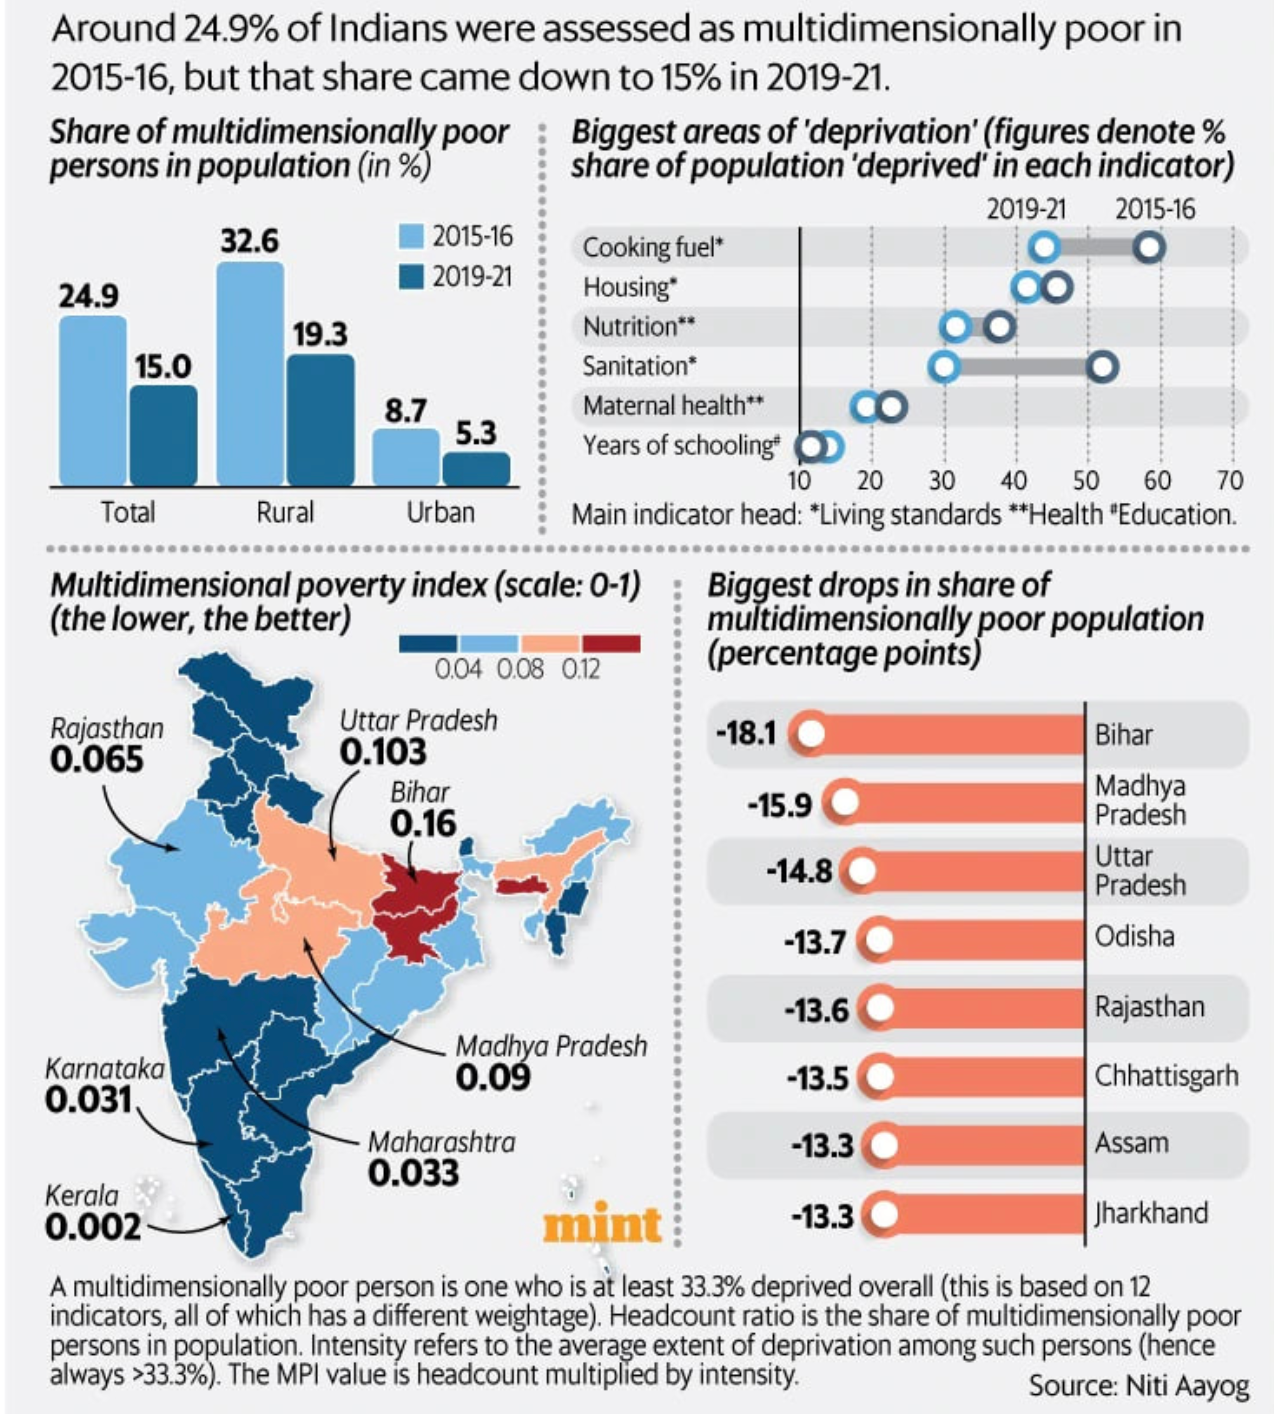
- Bihar, Jharkhand and Meghalaya fare the worst on the Multi-dimensional poverty index.
Bihar, the state with the highest MPI value in NFHS-4 (2015-16), saw the fastest reduction in MPI value in absolute terms with the proportion of multidimensional poor reducing from 51.89% to 33.76% in 2019-21.
- The next fastest reduction in the MPI value was seen in Madhya Pradesh and Uttar Pradesh
Outcome of NITI Aayog Report
- National MPI:
- Report underlines the Government’s commitment to understanding, measuring, and addressing the many dimensions of poverty and leveraging this understanding as a key tool in policymaking.
- Baseline Report:
- The baseline report of the national MPI has been pivotal in raising awareness among state governments, academia, civil society, and citizens about the significance of using multidimensional poverty measures.
- Ministries/Departments:
- Taking into account their priorities and development challenges, various Ministries/Departments have prepared action plans.
- More than 50 reform actions have been identified in 16 reform areas such as nutrition, financial inclusion, education, rural development, and housing among others.
- Collaboration with States:
- Ministries have started implementing these reforms. India’s stellar progress on the national MPI between 2015-16 and 2019-21 reflects the Government’s commitment to improving the quality of people’s lives.
- It became possible through targeted policies, schemes, and developmental programmes rolled out at both the national and sub-national levels.
- Investments:
- The Government’s focus on investments in critical areas of education, nutrition, water, sanitation, cooking fuel, electricity, and housing has played a pivotal role in driving these positive outcomes.
- Top-Down Approach:
- The findings from the second edition of the National MPI will serve as a valuable resource for States and UTs to identify and amplify actions right upto the district level.
- It will also enable them to track the progress of the vulnerable hotspots and pinpoint areas that require further targeted policy interventions and programmatic action.
- Key Government schemes that have contributed significantly in driving the tremendous progress presented in this report are:
- Swachh Bharat Mission (SBM)
- Jal Jeevan Mission (JJM)
- Poshan Abhiyan
- Samagra Shiksha
- Pradhan Mantri Sahaj Bijli Har Ghar Yojana (Saubhagya)
- Pradhan Mantri Ujjwala Yojana (PMUY)
- Pradhan Mantri Jan Dhan Yojana (PMJDY)
- Pradhan Mantri Awas Yojana (PMAY)
Steps Taken to Reduce Multidimensional Poverty
- State Support Mission (SSM)
- It is an overarching umbrella initiative of NITI Aayog to reinvigorate its ongoing engagement with States and UTs.
- Under this mission, NITI Aayog supports the States/UTs in capacity building and setting up State Institutions for Transformation (SIT).
- SSM would facilitate the strengthening of SDG localisation efforts which in turn would aid further reduction in multidimensional poverty.
- Progress Dashboard
- To effectively monitor the progress of implementation, a dashboard has been developed by the Development Monitoring and Evaluation Office (DMEO), an attached office under NITI Aayog, to leverage the monitoring of select Global Indices including MPI.
- This dashboard can track the progress of State-led reforms aimed at improving outcomes for a reduction in multidimensional poverty.
- The data from this edition of the national MPI will also be made available to States on the dashboard to enable real-time tracking of multidimensional poverty across various indicators.
Limitations of the Multidimensional Poverty Index
- Poverty is a complex issue with many factors, making it difficult to address all aspects.
- Gathering data for multidimensional indicators can be challenging.
- The large number of indicators can be overwhelming and lead to ineffective implementation.
- MPI does not capture intra-household inequality or inequality among the poor.
- It is also challenging to determine which dimensions are relevant and how many should be considered or prioritized.