Table of contents
Statistics is an important part of a civil servant’s job as mentioned before. It could be anything from unemployment rates in the country/state to the yield of various crops in a quarter. As officers, you are expected to understand these figures in the form of tables or charts or graphs and also fish out usable information from them.
In the IAS prelims exam, data can be provided to you in the form of tables, bar graphs, line graphs, pie charts, etc. You will also be given some information and instructions. Based on them, you must answer the questions asked. Usually, there would be multiple questions based on the same data.
Note: To candidates not used to it, the data might look scary, but it really isn’t. Just follow a procedure and you will be able to solve the questions pretty easily. The problem in Data Interpretation is based on three basic arithmetic techniques i.e.,
- Percentage.
- Ratio.
- average.
Questions can be asked regarding- - Maximum and minimum values.
- Average value.
- Percentage.
- Maximum and minimum ratios of any two parameters.
- Rate of increase or decrease.
- Irregularities.
Check out our CSAT Course
Practice Questions:
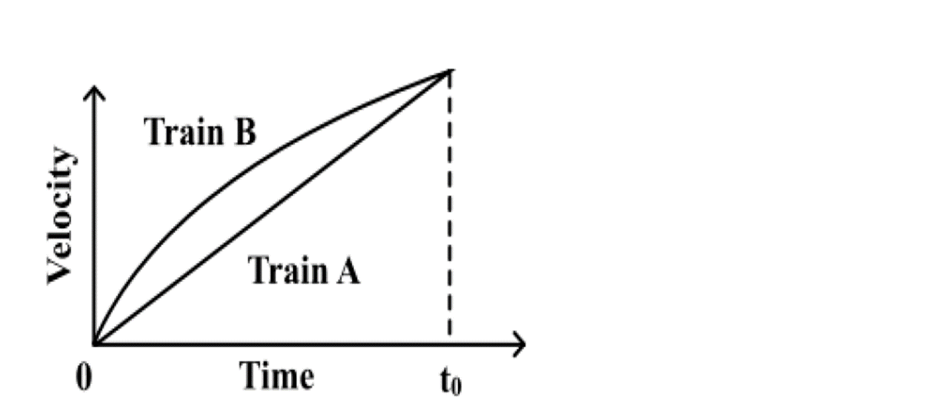
Q1. With reference to the above graph, which one of the following statements is not correct ?
(a) Train B has an initial acceleration greater than that of Train A.
(b) Train B is faster than Train A at all times.
(c) Both trains have the same velocity at time t0’
(d) Both trains travel the same distance in time to units.
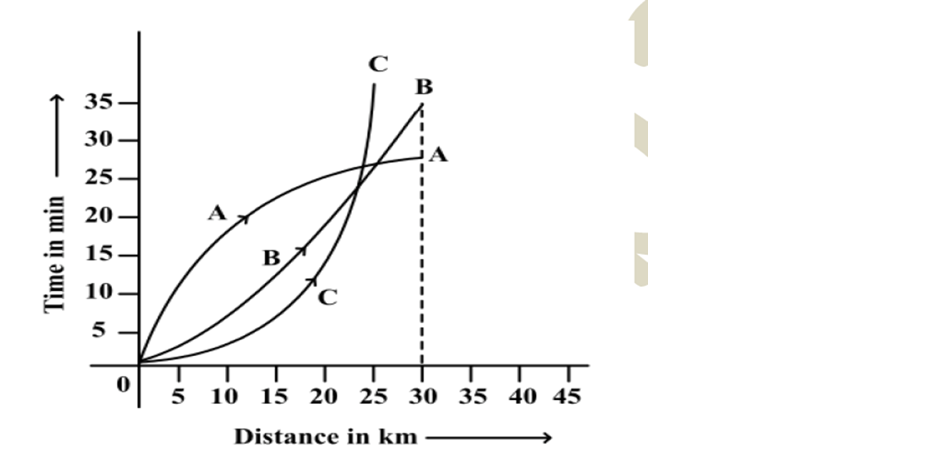
Q2. Consider the above distance - time graph. The graph shows three athletes A, Band C running side by side for a 30 km race.
With reference to the above graph consider the following statements :
1. the race was won by A.
2. B was ahead of A up to 25 km 26 mark.
3. C ran very slowly from the beginning.
Which of the statements given above is/are correct ?
(a) 1 only
(b) 1 and 2 only
(c) 2 and 3 only
(d) 1, 2 and 3
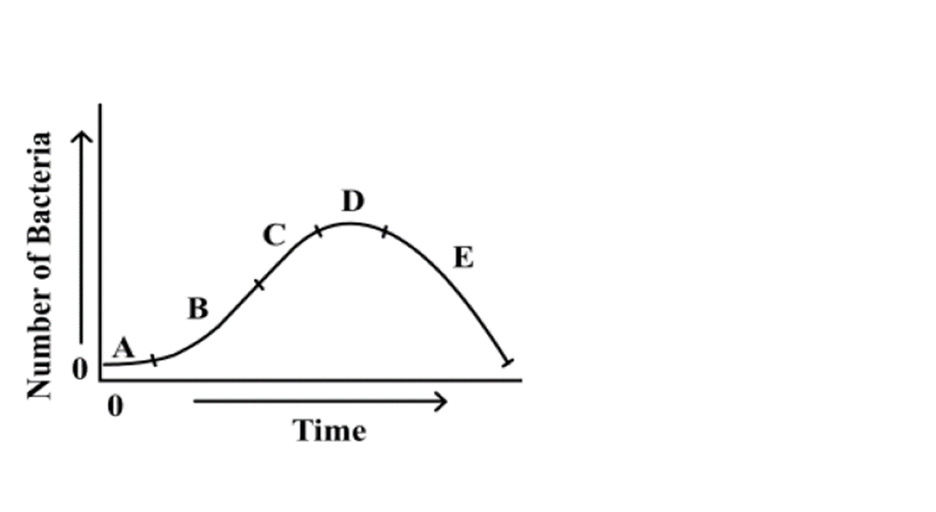
Q3. On the basis of above graph ::
- Which region/regions of the curve correspond/corresponds to incubation phase of the infection ?
- Which region of the curve indicates that the person began showing the symptoms of infection ?
- Which region of the curve indicates that the treatment yielded effective relief?
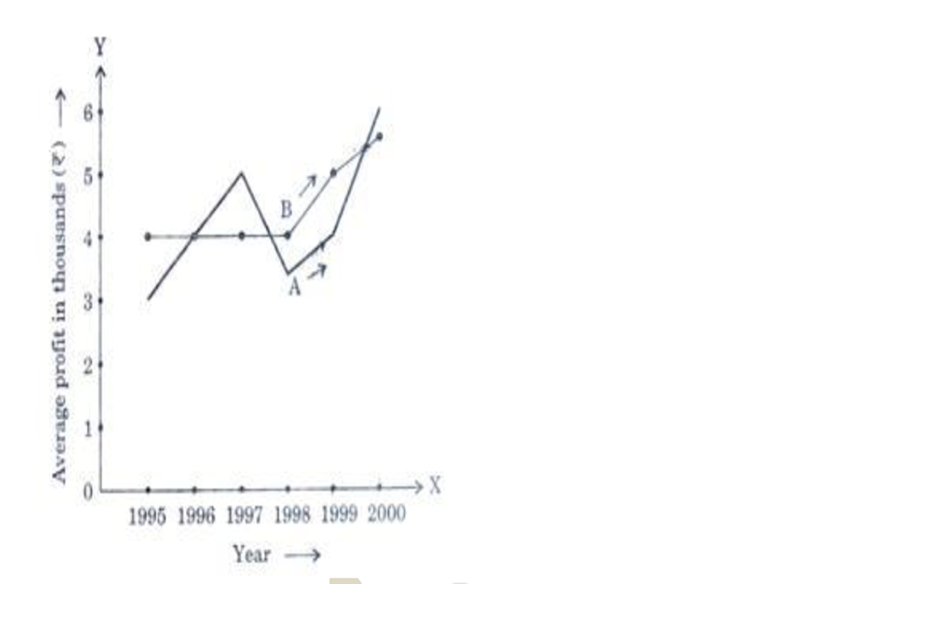
Q4. Follow the above graph and answer the following question ::
- In which year is the average profit of A and B same?
- What is the difference between the average profit of B and A in the year 1998?
- How much more average profit did A make in the year 2000 than in the year 1999?
- What is the trend of the average profit of B from the year 1997 to the year 2000?
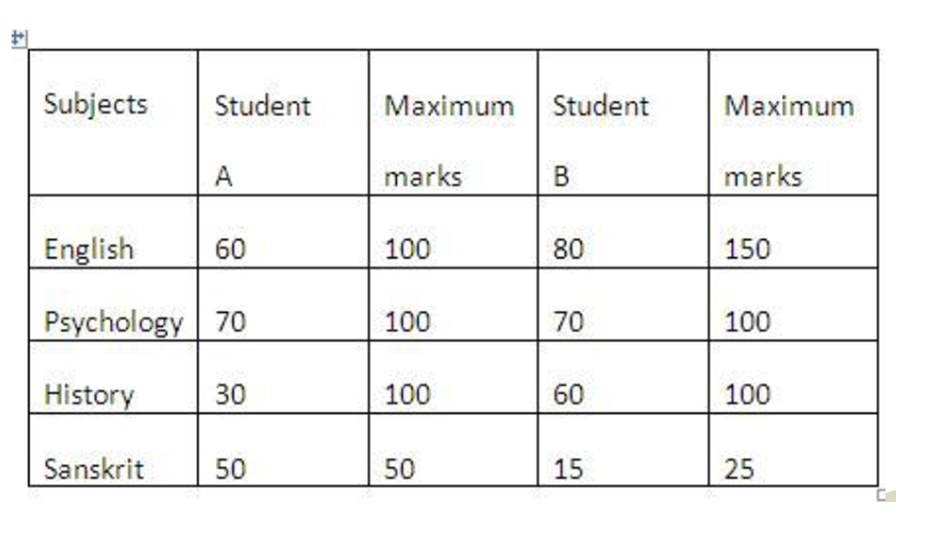
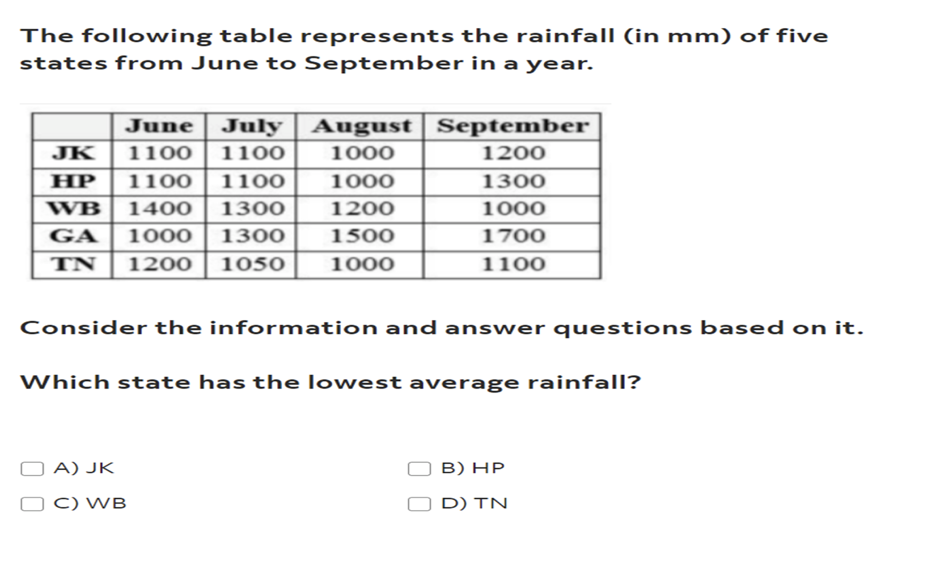
Q5. follow the above table and answer the following question.
The difference in the mean aggregate percentage marks of the students is
(a) 2.5%
(b) 13.75%
(c) 1.25%
(d) Zero
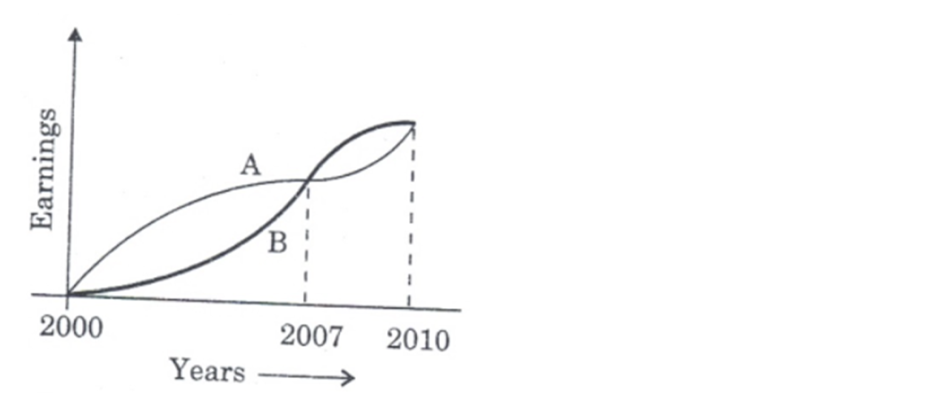
Q6. From the above graph, which one of the following can be concluded?
(a) On the average A earned more than B during this period.
(b) On the average B earned more than A during this period.
(c) The earnings of A and B were equal during this period.
(d) The earnings of A were less as compared to B during this period.
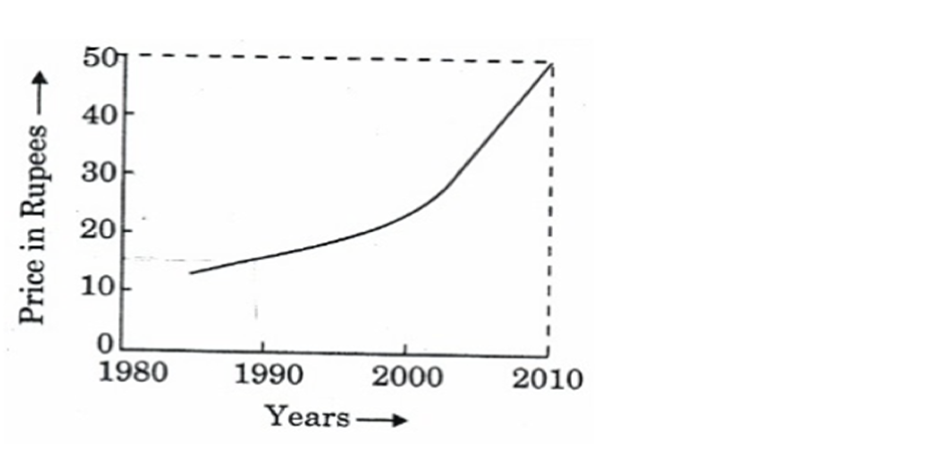
Q7. On the basis of above graph what is the price of the commodity in the year 1990
a) must have been Rs. 10/-
b) must have been Rs. 12/-
c) must have been anywhere between Rs. 10/- and Rs. 20/-
d) is higher than that in the year 1991
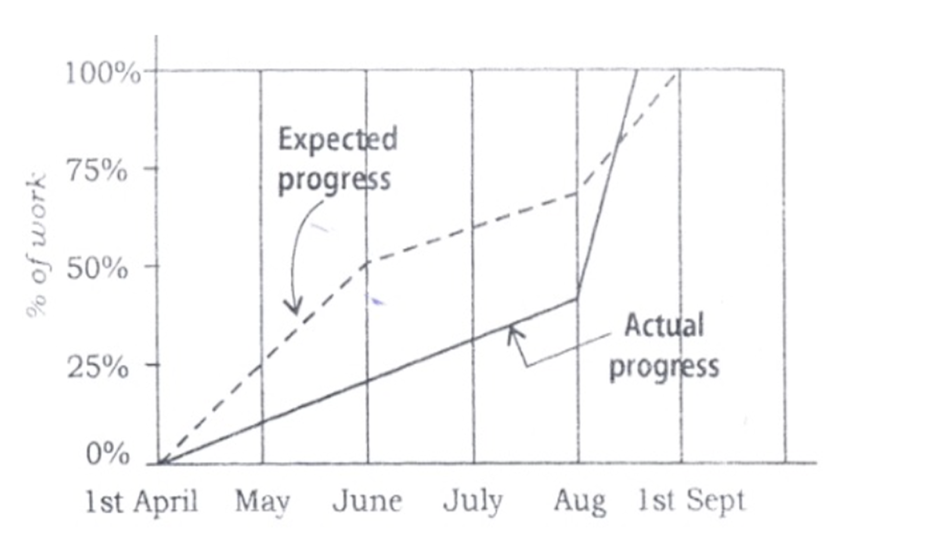
Q8. Which one of the following statements is not correct with reference to the graph given above?
(a) On 1st June, the actual progress of work was less than expected.
(b) The actual rate of progress of work was the greatest during the month of August.
(c) The work was actually completed before the expected time.
(d) During the period from 1st April to 1st September, at no time was the actual progress more than the expected progress.
Q9.
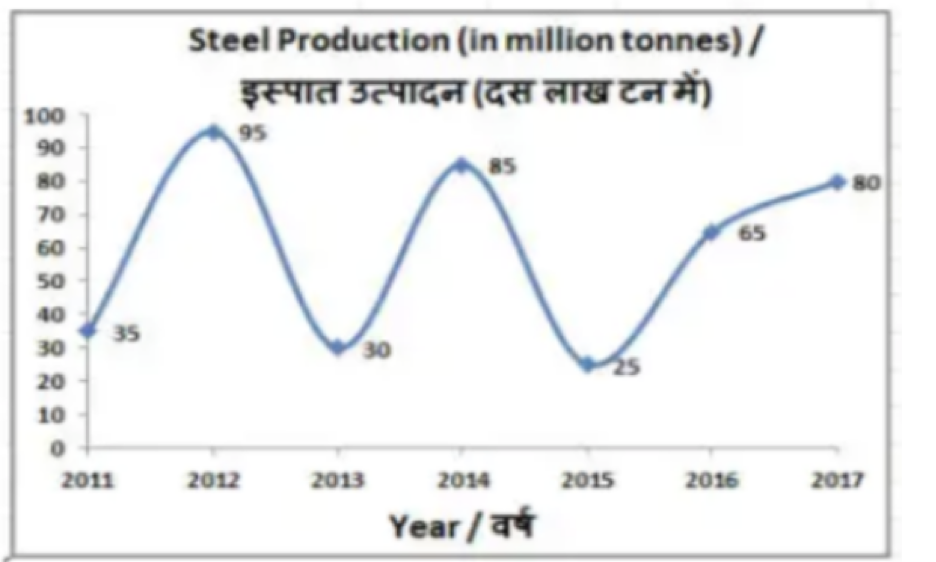
Q10. As per the above graph, if 1 tonne of steel cost Rs 30000 what was the cost (in billion rupees) of steel production in year 2017.
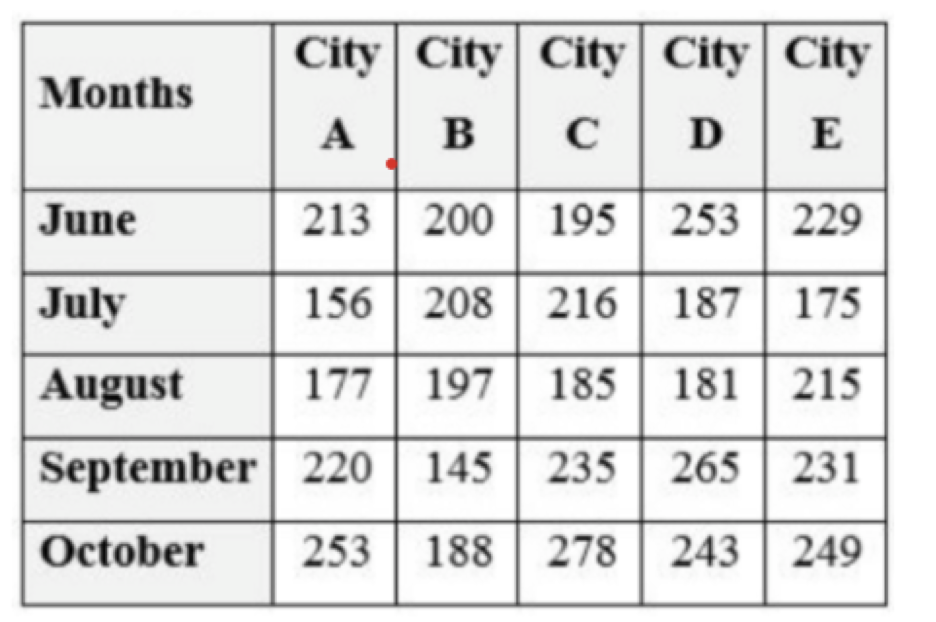
Q11. On the basis of above table answer the following ::
- If 30% of the total books sold by City B, D, AND E together in July were academic books, how many non-academic books were sold by them in the same month?
- What is the respective ratio between the total number of books sold by city A in July and September together and a total number of books sold by city E in August and October together?
- What is the average number of books sold by City C in July, September and October together?
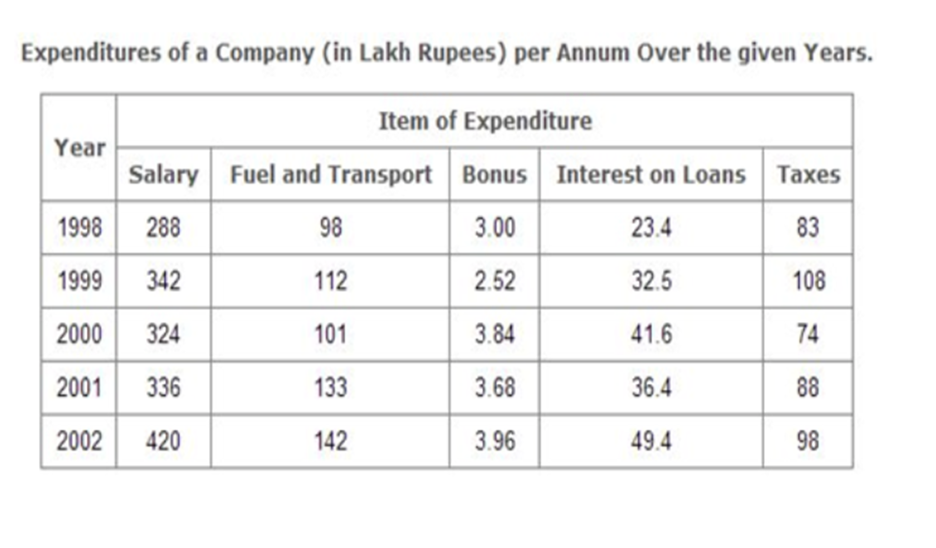
Q12. On the basis of above table, the total expenditure on all these items in 1998 was approximately what percent of the total expenditure in 2002?
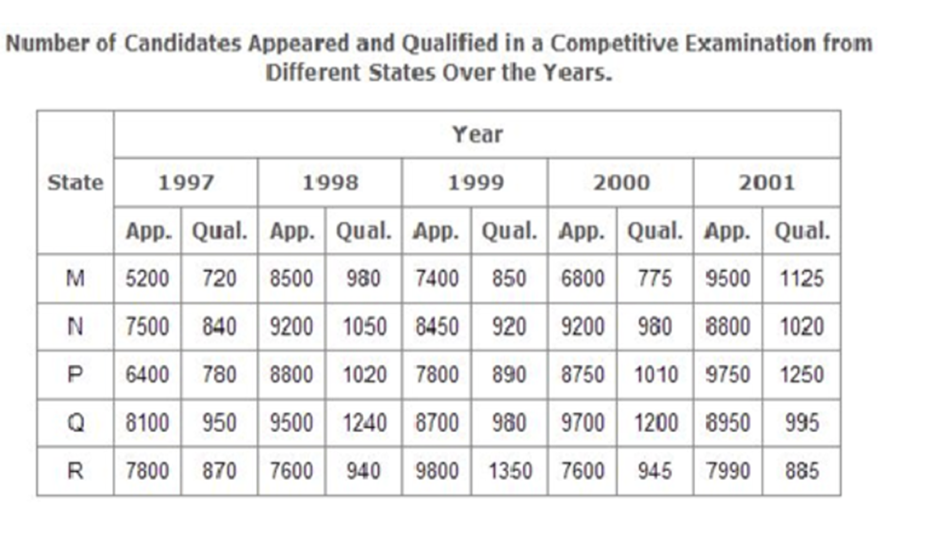
Q13. On the basis of above table, answer the following questions::
- Total number of candidates qualified from all the states together in 1997 is approximately what percentage of the total number of candidates qualified from all the states together in 1998?
- In which of the given years the number of candidates appeared from State P has maximum percentage of qualified candidates?
- What is the percentage of candidates qualified from State N for all the years together, over the candidates appeared from State N during all the years together?
- The percentage of total number of qualified candidates to the total number of appeared candidates among all the five states in 1999 is?
- Combining the states P and Q together in 1998, what is the percentage of the candidates qualified to that of the candidate appeared?
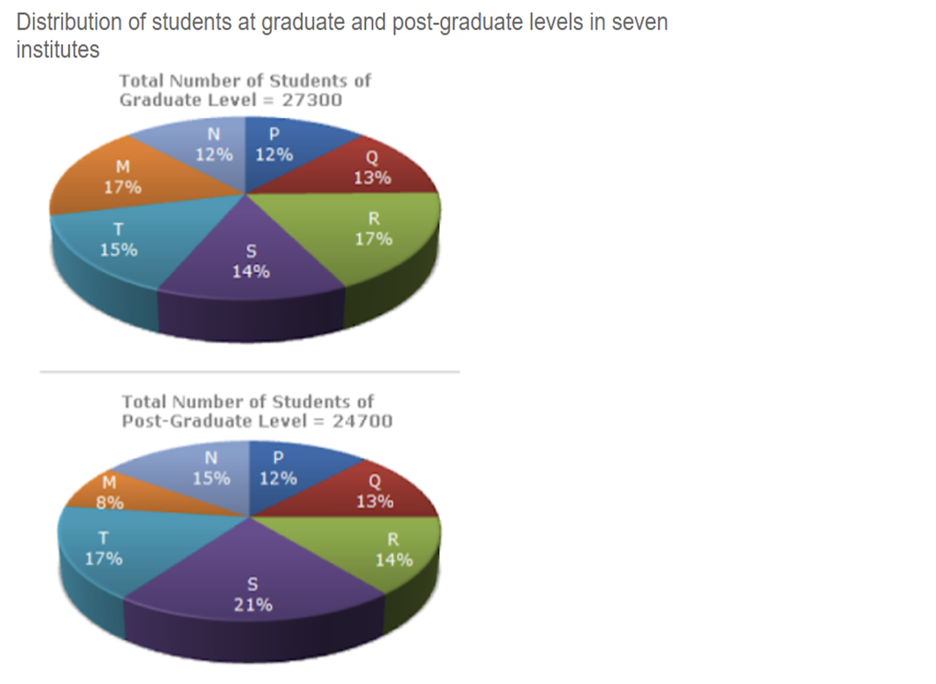
Q14. What is the total number of graduate and post-graduate level students in the institute R?
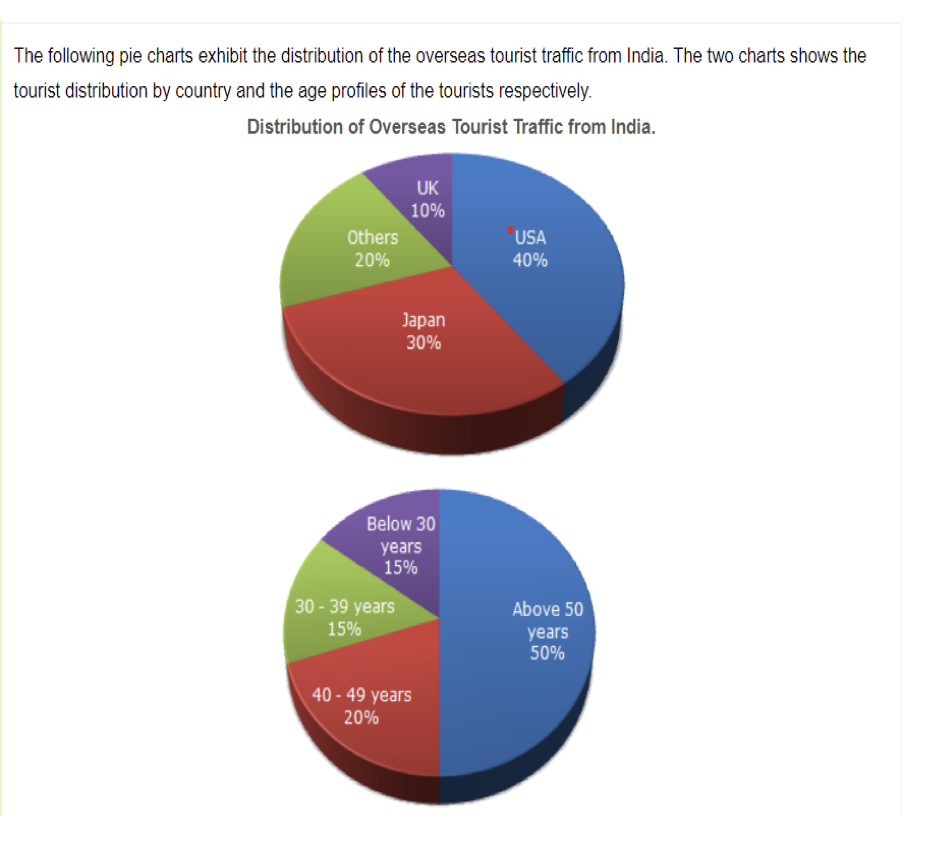
For question 15-17, follow the above pie chart.
Q15. What percentage of Indian tourist went to either USA or UK ?
Q16. The ratio of the number of Indian tourists that went to USA to the number of Indian tourists who were below 30 years of age is ?
Q17. If amongst other countries, Switzerland accounted for 25% of the Indian tourist traffic, and it is known from official Swiss records that a total of 25 lakh Indian tourists had gone to Switzerland during the year, then find the number of 30-39 year old Indian tourists who went abroad in that year ?
Log-in to access answers for Data Interpretation and other topics!
If you have made it so far, well done. You are ahead of the competition.
Best of luck!