
Table of contents
The UPSC Civil Services Examination demands a comprehensive understanding of the Indian economy. A crucial aspect of this understanding is deciphering macroeconomic trends. This introductory section delves into the concept of macroeconomic trends and the key factors influencing them in the Indian context.
Macroeconomics focuses on the big picture – the overall performance of an economy. Macroeconomic trends encompass broad patterns in areas like:
- Economic Growth: The rate at which the economy produces goods and services.
- Inflation: The rise in prices of goods and services over time.
- Unemployment: The number of people actively seeking work but unable to find it.
- Interest Rates: The cost of borrowing money.
- Exchange Rate: The value of a country's currency compared to other currencies.
Let's look into these trends important for UPSC Prelims 2024:
Loan-Write Offs
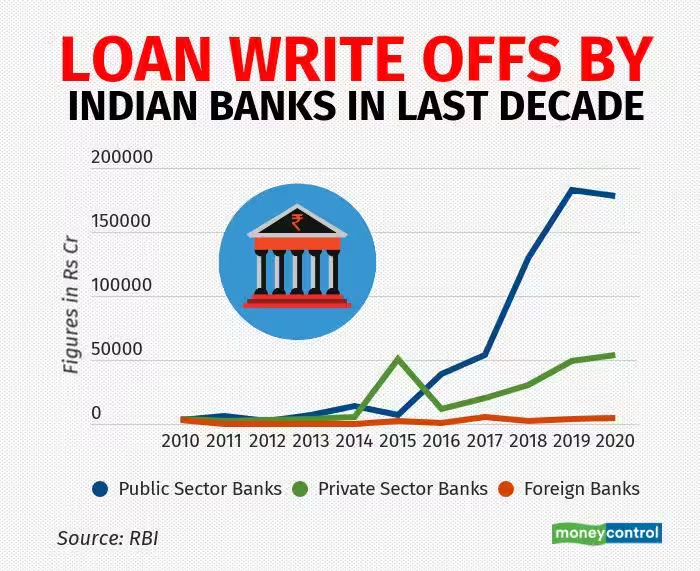
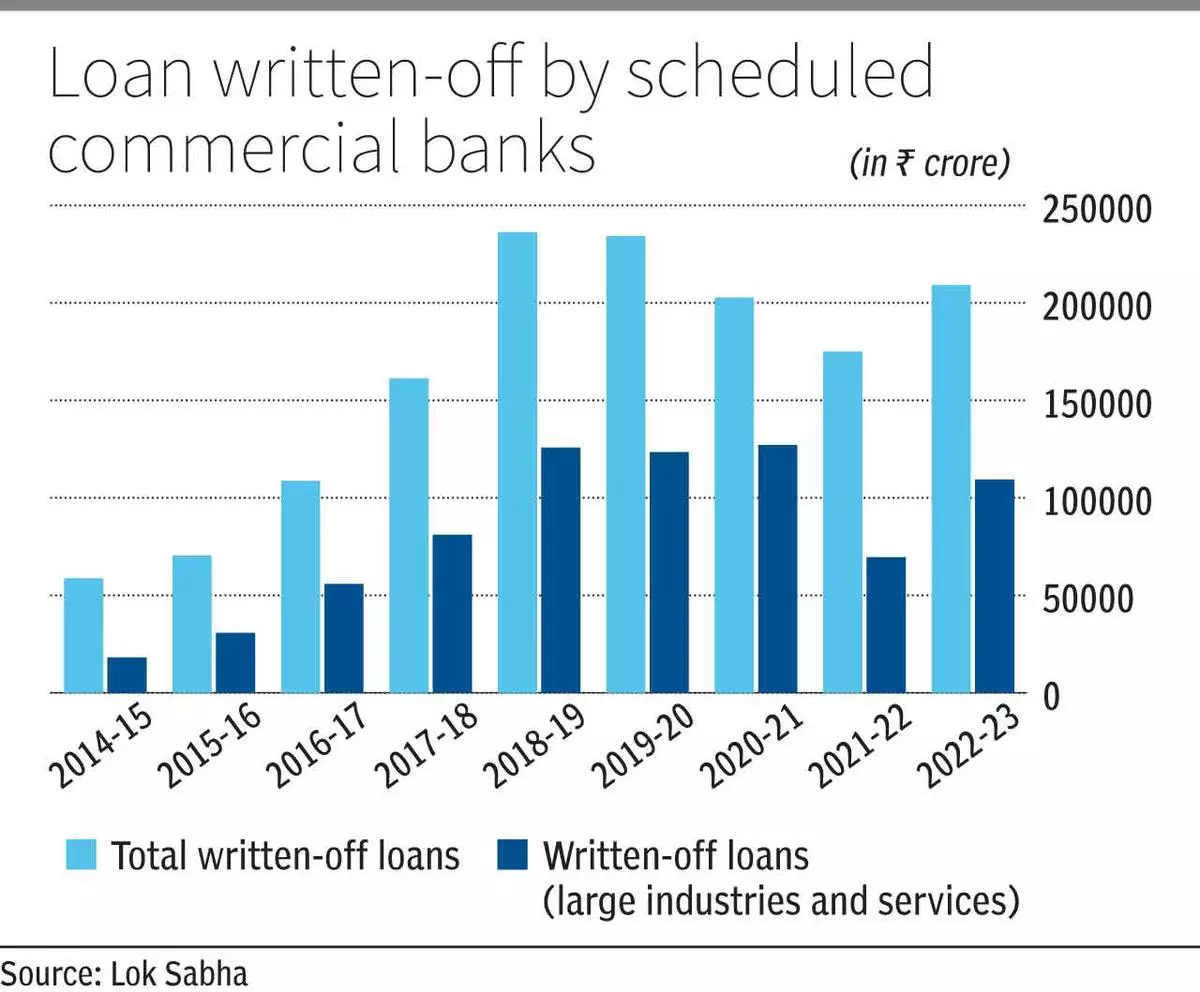
- Scheduled commercial banks wrote off non-performing assets worth Rs 9,91,640 crore from 2017-18 to 2021-22.
- Writing off loans means it will no longer be counted as an asset and it helps banks reduce the level of non-performing assets.
- This is done to reduce the bank’s tax liability because there is a very low chance of recovery.
- All loan write-offs are not lost money and many of them continue to be on the birth register of banks.
- It is different from farm loan waivers as waivers involve the government taking the outstanding debt of farmers by providing a budgetary allocation to banks.
Jobless Growth
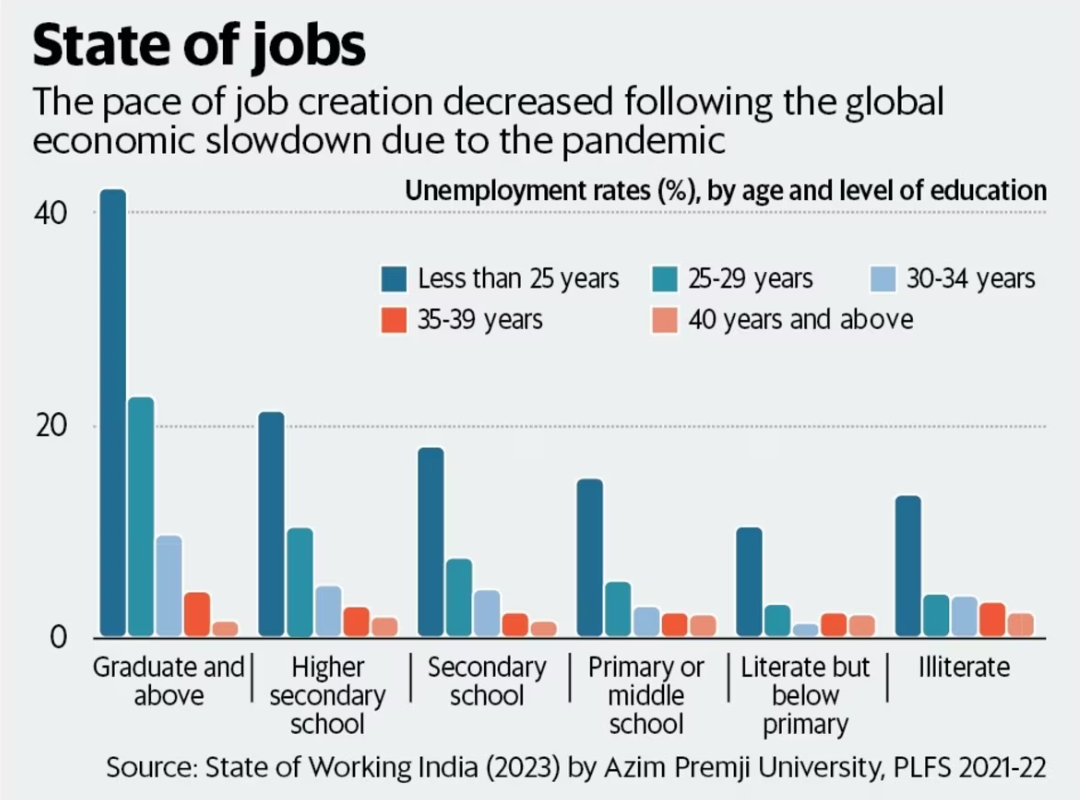
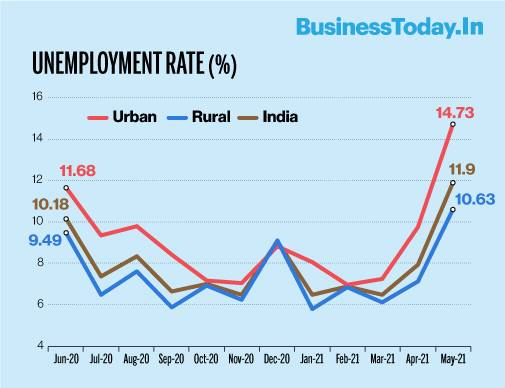
- Jobless growth is a situation where economic growth does not lead to job creation.
- The unemployment for below primary educated class was 1.13% while it was 14.73% in 2020–21 for graduates and above.
- The decline of LFPR is higher for females as compared to males and the overall female Work Force Participation Rate (WFPR) aged 15–59 in 2020–21 was 32.46% which is 44.55 percentage points below that of men.
- It can be due to factors like global economic slowdown, dominant Informal sectors, lack of skills and under utilization of resources
- Jobless growth means underutilization of human capital which increases poverty, lower per capita income and malnutrition.
RBI Autonomy
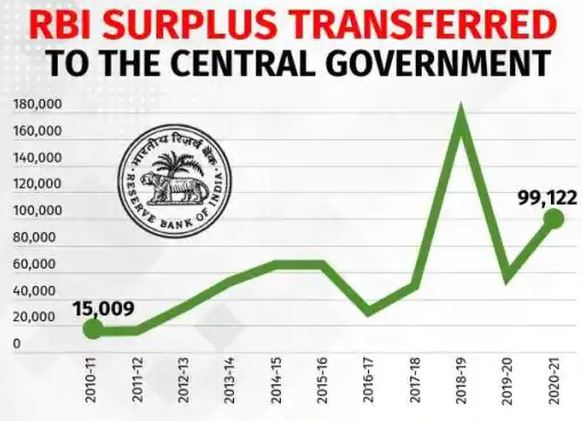
- ‘Autonomous’ word is not mentioned in the Reserve Bank of India Act, 1934 but it is commonly accepted that the principle of Central Bank autonomy is important.
- The Central government may give such directions to the RBI as it may consider necessary in the public interest under Section 7 of the Act.
- This power was exercised when the RBI announced a surplus transfer of 991.22 billion rupees for the 9 months from July 2020 to March 2021.
- Also, the departure of RBI governors Mr Raghuram Rajan and Mr Urjit Patel raised questions about increasing government control.
- Also, the exercise of demonetisation was questioned as there was no mention of RBI in this decision.
- Money supply is an integral aspect of monetary policy, and the Monetary Policy Committee was excluded for some time from decision-making on monetary policy
- Central banks work on long-term financial stability and growth, which requires autonomy and limited interference by the government.

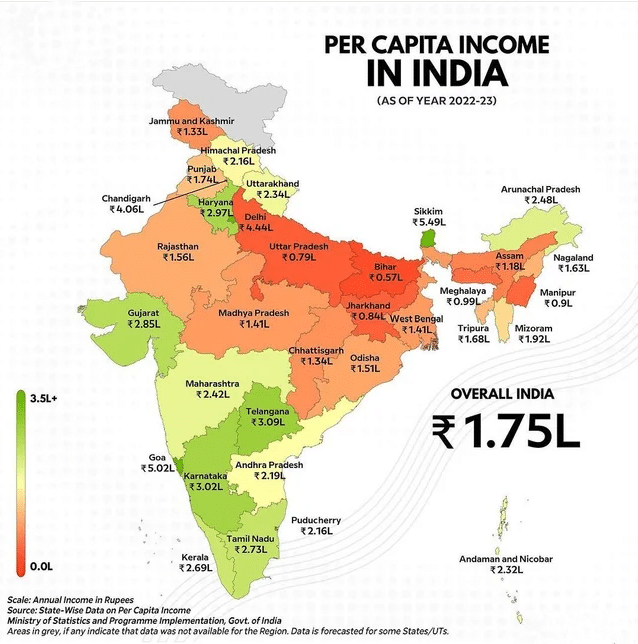
Income Inequality
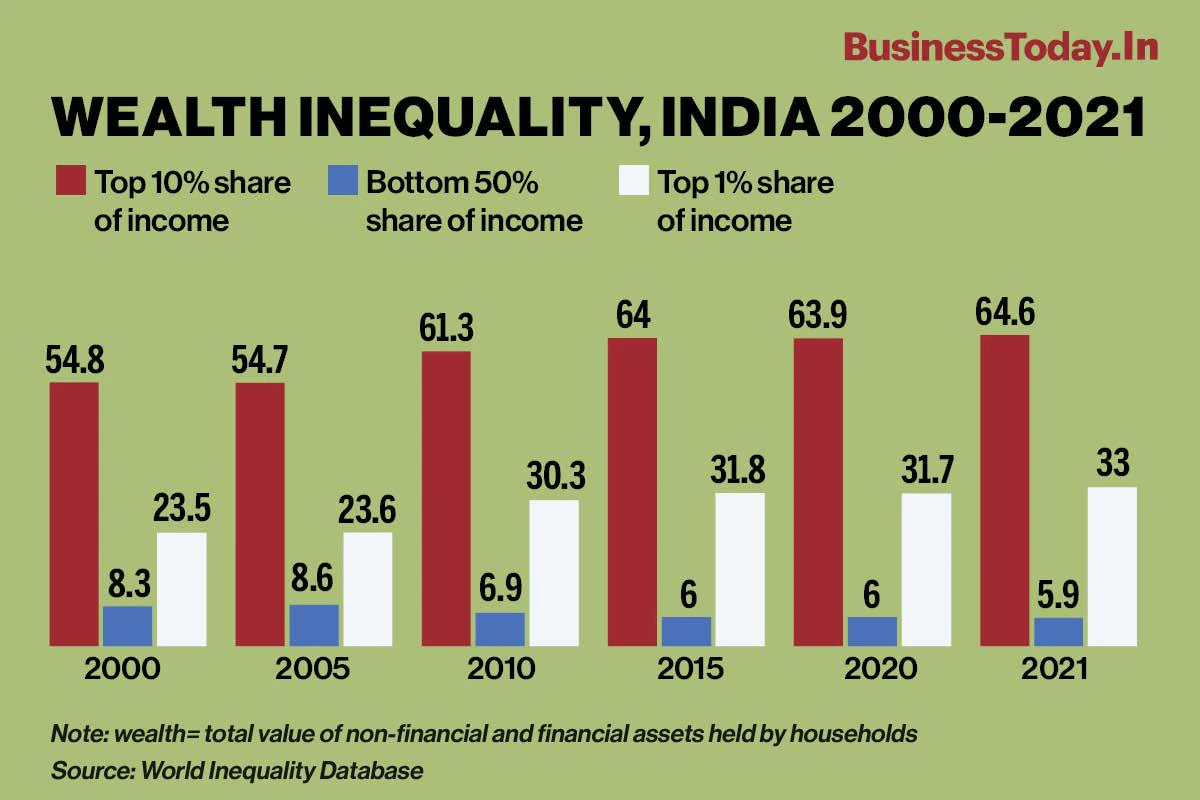
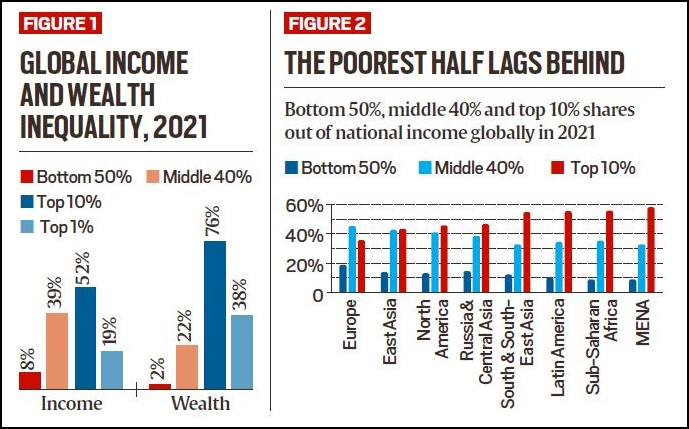
- Income inequality means unequal distribution of income among individuals or households within a population.
- It can be measured using Gini coefficient, Lorenz curve or the ratio of income shares between different percentiles of the population.
- Top 10% of the population holds 77% of the total national wealth, the richest 1% owns 53% of the country’s wealth while the poorer half has merely 4.1% of national wealth.
- Geographical divide is also visible when per capita State Domestic Product is compared with the national average.
- The per capita SDP of the higher-income states was 1.7 times that of the lower-income states during 1990-91 which increased to 2.5 times by 2019-20.
Household Savings
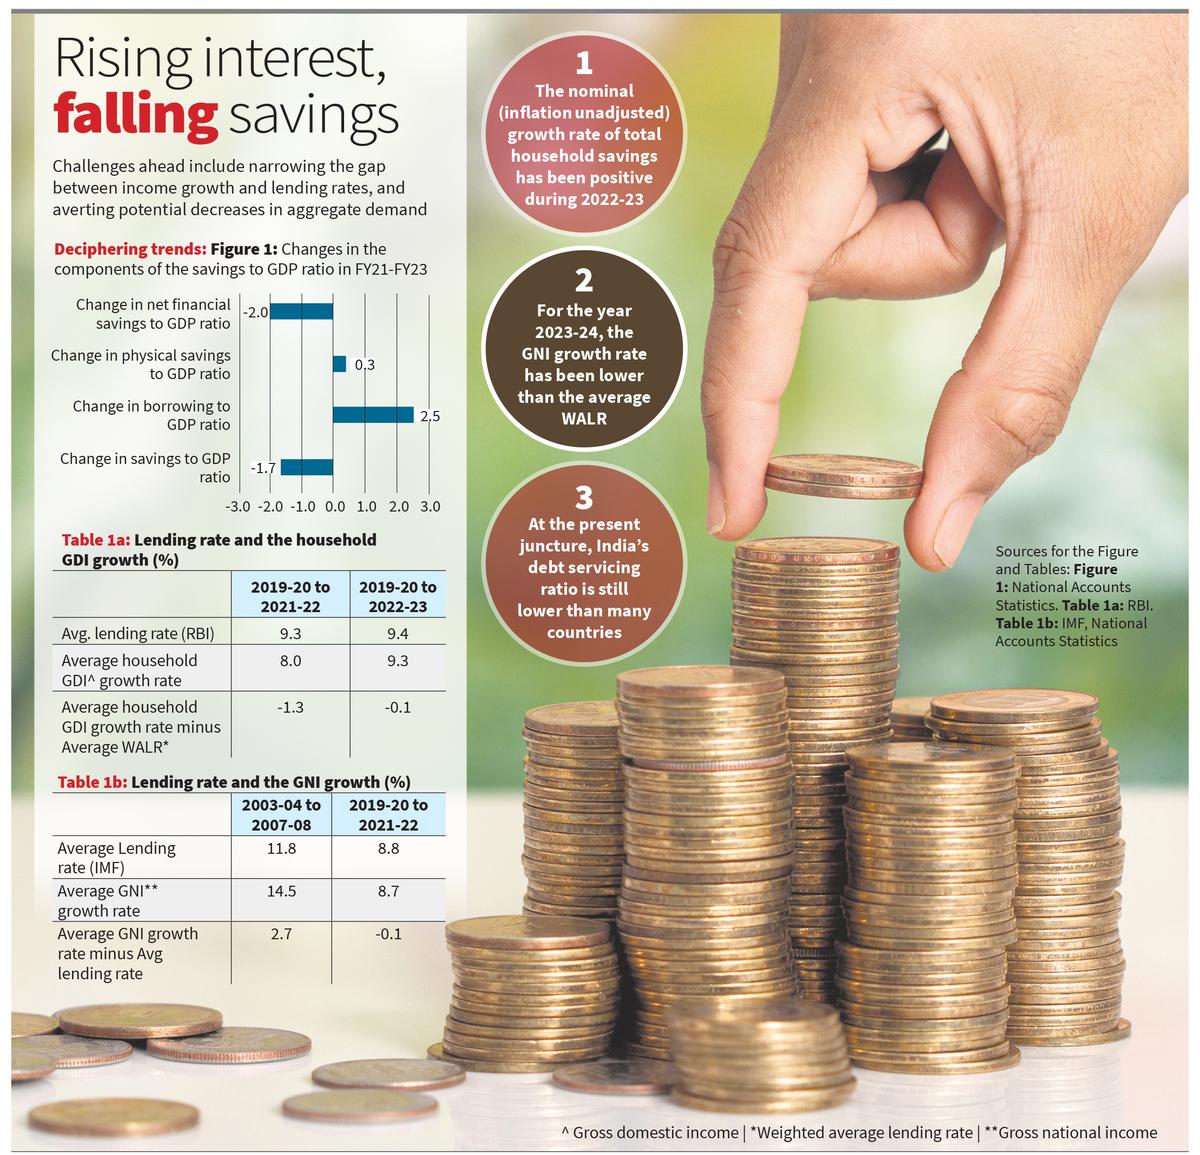
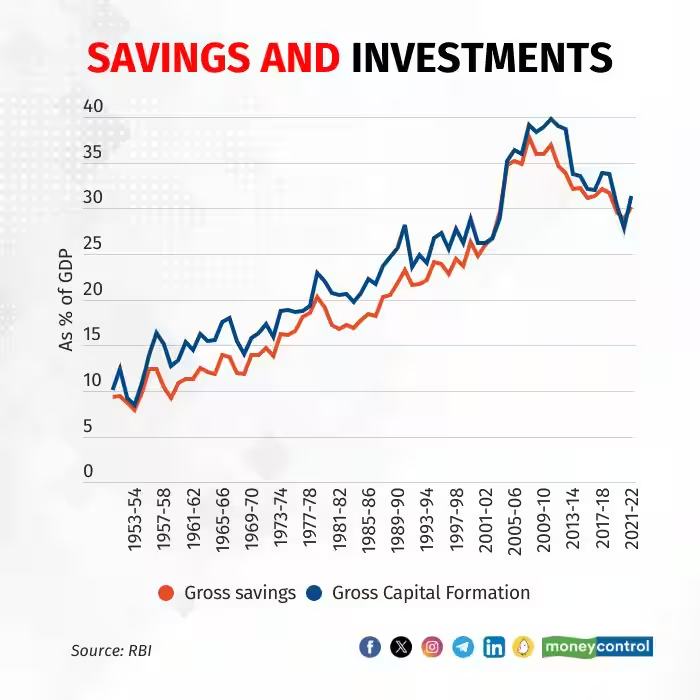
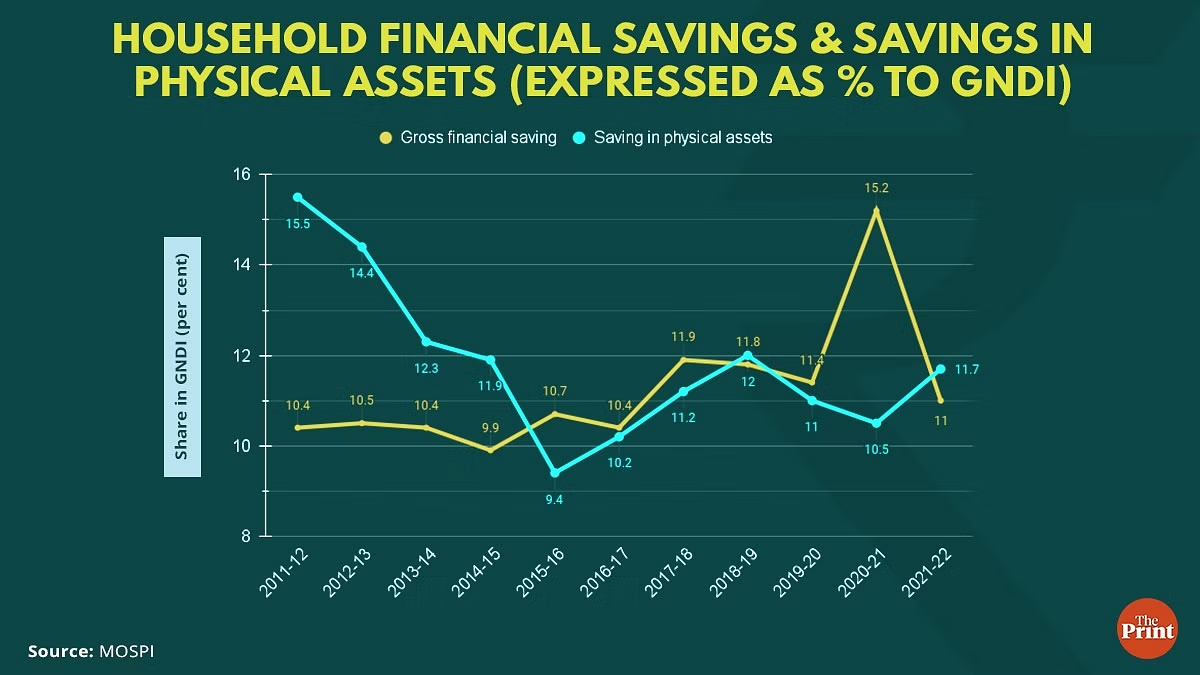
- The household savings to GDP ratio is the sum of its physical savings to GDP ratio, net financial savings to GDP ratio and gold and ornaments.
- A huge fall in household net financial savings to GDP ratio was seen during 2022-23 due to a higher borrowing to GDP ratio which is driven by a need to finance interest payments.
- Net financial savings to GDP ratio declined by 2.5 percentage points and the physical savings to GDP ratio increased by 0.3 percentage points.
- The household borrowing to GDP ratio increased by 2 percentage points.
Per-Capita Income
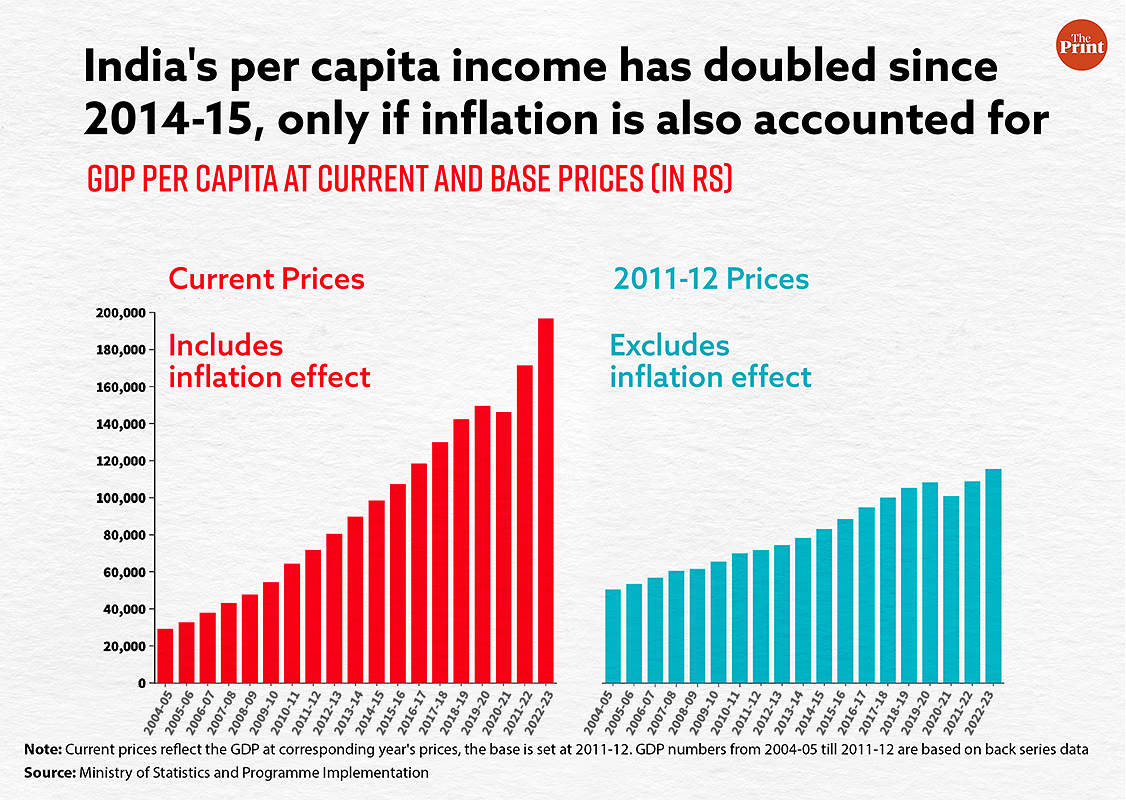
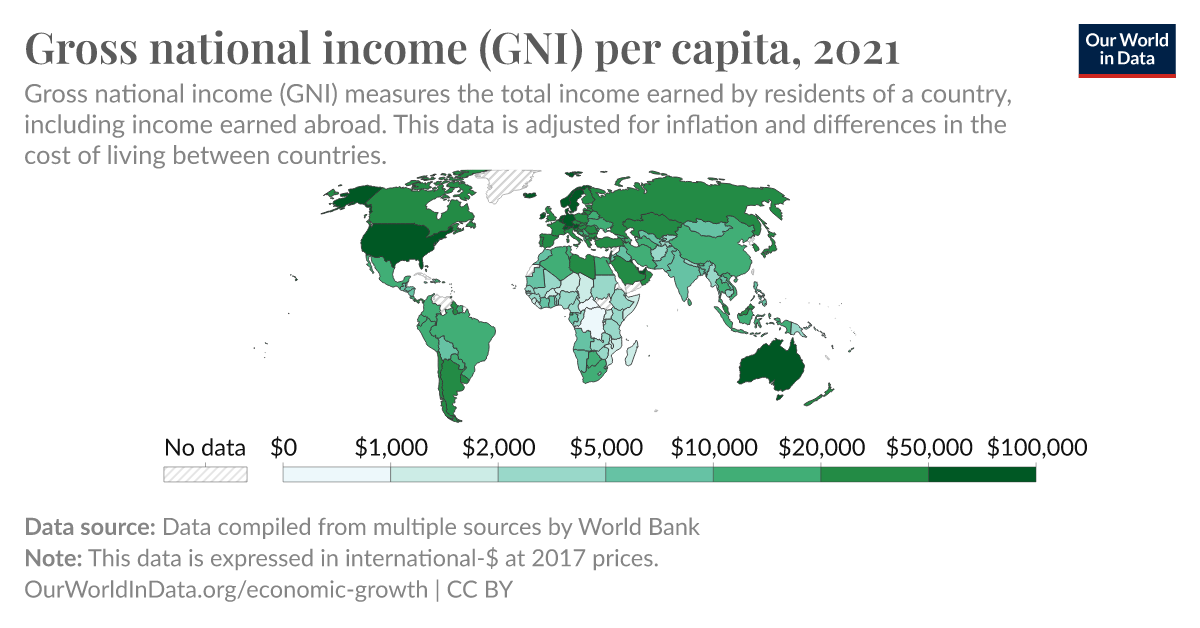
- All India annual per capita Net National Income (NNI) for 2014-15 and 2022-23 at current prices are Rs. 86,647 and Rs. 1,72,000 respectively illustrate achievement in this regard.
- When calculating a country's PCI, every individual is taken into account. The calculation includes men, women, children, and babies. This is mainly because the measurement considers the entire country's population or specific geographical location.
- PCI is used to calculate Gross Domestic Product Per Capita, Gross National Income Per Capita, conduciveness of business etc.
- But there are some limitations also like Per Capita Income doesn't account for an economy's inflation, inclusion of non-earning individuals, not considering every individual's savings and welfare indicators like quality of working conditions.
Inflation
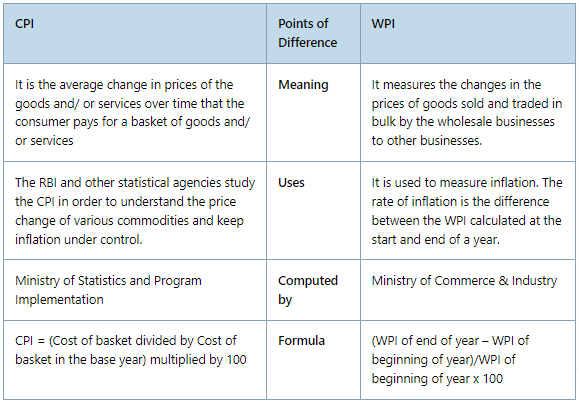
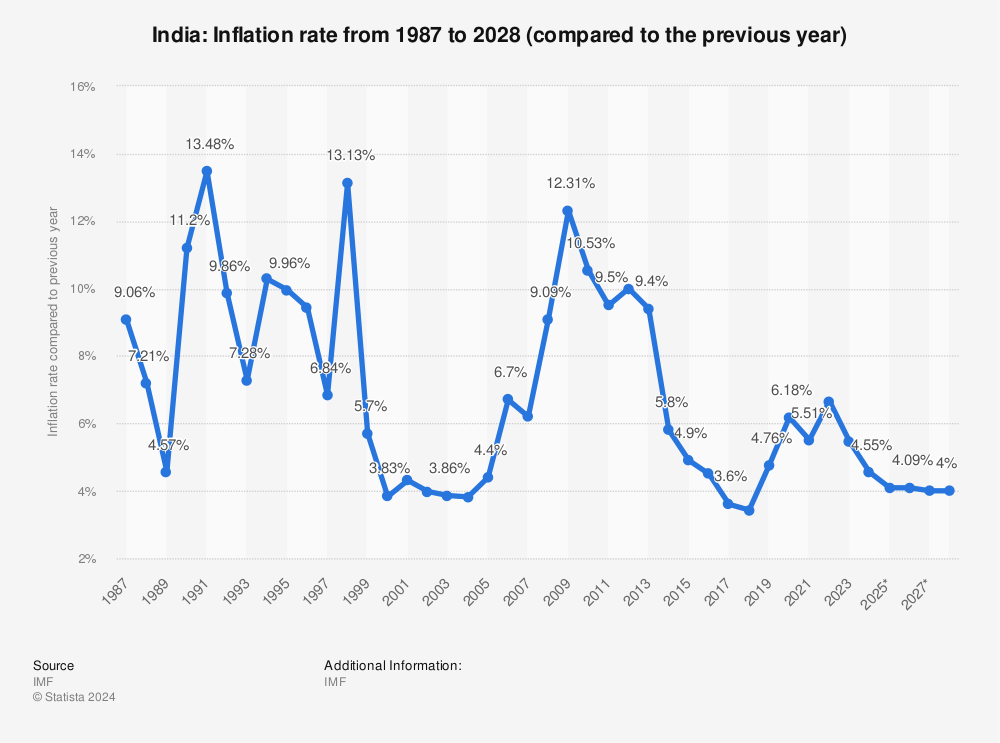
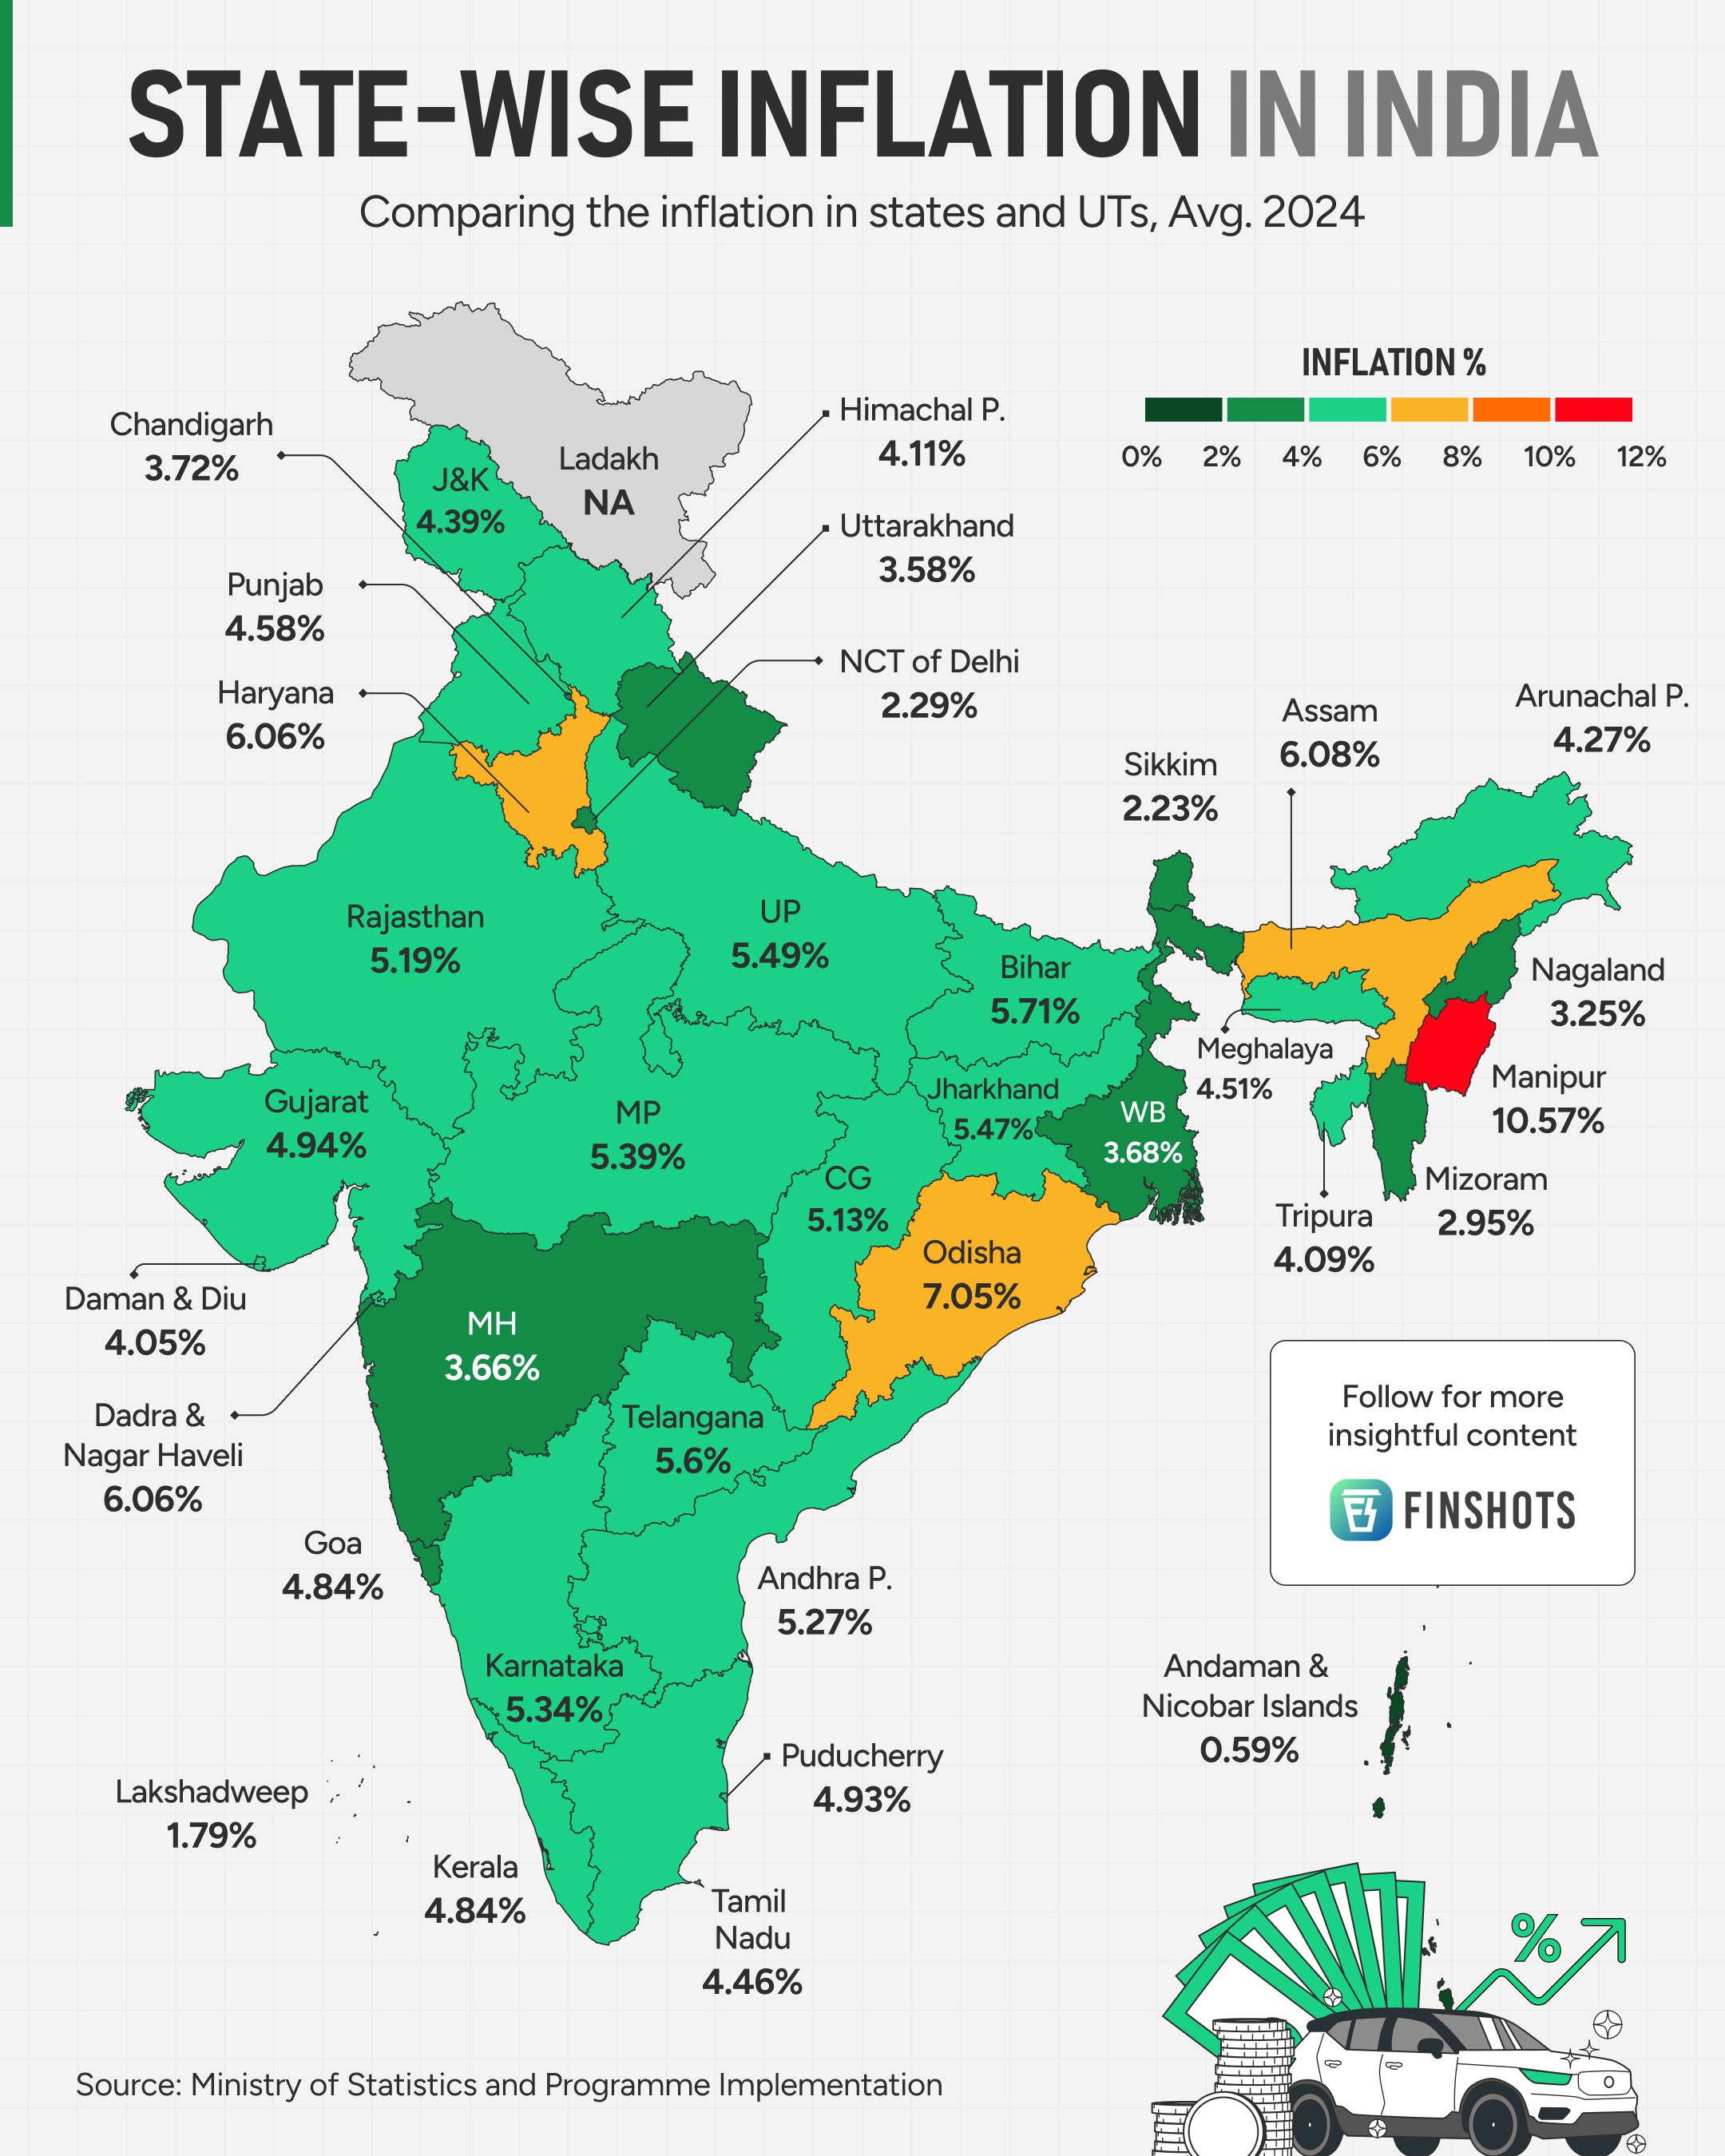
- Inflation involves general rise in price of commodities due to demand and supply constraints. Its impacts are multidimensional-
- High inflation undervalues the stock prices, reduces purchasing power and value of gold increases.
- It results in higher Interest rates thus higher lending rates.
- High inflation can result in decreased international competitiveness.
- Creditors are affected as the value of the money received from debtors decreases.
- Also, there is ‘Wage-Price Spiral’ in which there is a cycle of rising wages and prices.