Table of contents
Relevance for UPSC CSE
- GS 1 - Poverty and developmental issues
- GS 2 - Issues relating to poverty and hunger.
- GS 3 - Food Security
What is poverty?
Poverty is a state or condition in which a person or community lacks the financial resources and essentials for a minimum standard of living. Poverty means that the income level from employment is so low that basic human needs can't be met. Poverty is said to exist when people lack the means to satisfy their basic needs.
Data/Statistics
- 8.8% of the population lives in severe multidimensional poverty (Multidimensional Poverty Index, 2018)
- In India, 21.9% of the population lives below the national poverty line in 2011.
- Global Hunger Index (GHI) report for 2020 ranks India at 94 out of 107 countries
Types of Poverty
- Absolute Poverty - Absolute poverty refers to when a person or household does not have the minimum amount of income needed to meet the minimum living requirements
- Relative Poverty - It is a measure of income inequality. It is related to living standard of a person/family compared to the living standards of population in surroundings. Eg. In a surrounding where everyone has 4 cars, a person with 2 cars might be called as in relative poverty.
How poverty is measured?
- The poverty in India is measured on the basis of poverty line quantified in terms of per capita consumption expenditure
- Data is obtained from the large sample survey of consumer expenditure data of the National Sample Survey Office (NSSO).
- Households with consumption expenditures below the poverty line are said to be “Below the Poverty Line (BPL)” and deemed to be poor.
Pre-Independence Poverty Estimation
- Poverty and Unbritish Rule in India (1901): Dadabhai Naoroji’ in his book ‘Poverty and Un-British Rule in India,’ made the earliest estimate of poverty line at 1867-68 prices (₹16 to ₹35 per capita per year) based on the cost of a subsistence diet.
- National Planning Committee (1938): In 1938, the National Planning Committee set up under the chairmanship of Jawaharlal Nehru suggested a poverty line (ranging from ₹15 to ₹20 per capita per month) based on a minimum standard of living.
- The Bombay Plan (1944): Bombay Plan proponents suggested a poverty line of ₹75 per capita per year.
Post- Independence Poverty Estimation
-
Working Group (1962): The poverty line in India was quantified for the first time in 1962 by this Group in terms of a minimum requirement (food and non-food) of individuals for healthy living
-
VM Dandekar and N Rath (1971): first established the consumption levels required to meet a minimum calorie norm. (2250 calories per person per day). Poverty level was calculated on the basis of expenses needed to fulfil this calorie criteria
-
Task Force on “Projections of Minimum Needs and Effective Consumption Demand” headed by Dr. Y. K. Alagh (1979): Official poverty counts began for the first time in India based on the approach of this Task Force. Poverty line was defined as the per capita consumption expenditure level to meet average per capita daily calorie requirement of 2400 kcal per capita per day in rural areas and 2100 kcal per capita per day in urban areas. Based on 1973-74 prices, the Task Force set the rural and urban poverty lines at Rs. 49.09 and Rs. 56.64 per capita per month at 1973-74 prices.
-
Lakdawala Expert Group (1993): Until the 1990s, no attempt was made to capture differences in prices or differences in consumption patterns across states or over time. In 1989, The Planning Commission constituted the Lakdawala Expert Group to "look into the methodology for estimation of poverty and to re-define the poverty line, if necessary". The Expert Group did not redefine the poverty line and retained the separate rural and urban poverty lines recommended by the Alagh Committee at the national level based on minimum nutritional requirements. However, it disaggregated them into state-specific poverty lines in order to reflect the inter-state price differentials.
-
Tendulkar Expert Group (2009): It recommended -
- Shift from Calorie Consumption based Poverty Estimation: It based its calculations on the consumption of the items like cereal, pulses, milk, edible oil, non-vegetarian items, vegetables, fresh fruits, dry fruits, sugar, salt & spices, other food, intoxicants, fuel, clothing, footwear, education, medical (non-institutional and institutional), entertainment, personal & toilet goods.
- Uniform Poverty line Basket: Unlike Alagh committee (which relied on separate PLB for rural and urban areas), Tendulkar Committee computed new poverty lines for rural and urban areas of each state based on the uniform poverty line basket and found that all India poverty line (2004-05) was ₹446.68 per capita per month in rural areas and ₹578.80 per capita per month in urban areas
- Private Expenditure: Incorporation of private expenditure on health and education while estimating poverty.
- Price Adjustment Procedure: The Committee also recommended a new method of updating poverty lines, adjusting for changes in prices and patterns of consumption (to correct spatial and temporal issues with price adjustment), using the consumption basket of people close to the poverty line.
- Mixed Reference Period: The Committee recommended using Mixed Reference Period based estimates, as opposed to Uniform Reference Period based estimates that were used in earlier methods for estimating poverty.
-
Rangrajan Committee (2014): Due to widespread criticism of Tendulkar Committee approach as well as due to changing times and aspirations of people of India, Rangarajan Committee was set up in 2012. It reverted to the practice of having separate all-India rural and urban poverty line baskets and deriving state-level rural and urban estimates from these. It recommended separate consumption baskets for rural and urban areas which include food items that ensure recommended calorie, protein & fat intake and non-food items like clothing, education, health, housing and transport. This committee recommended poverty line at monthly per capita consumption expenditure of Rs. 972 in rural areas and Rs. 1407 in urban areas is recommended. The government did not take a call on the report of the Rangarajan Committee. So, currently poverty in India is measured on the basis of Tendulkar Committee Report.
Causes of Poverty
- Lack of good jobs/job growth - In india over 90% population is employed in informal sector. Also, according to recent Periodic Labour Force Survey (PLFS) for 2020-21 released by the Ministry of Statistics and Programme Implementation, the unemployment rate in India is 4.2%
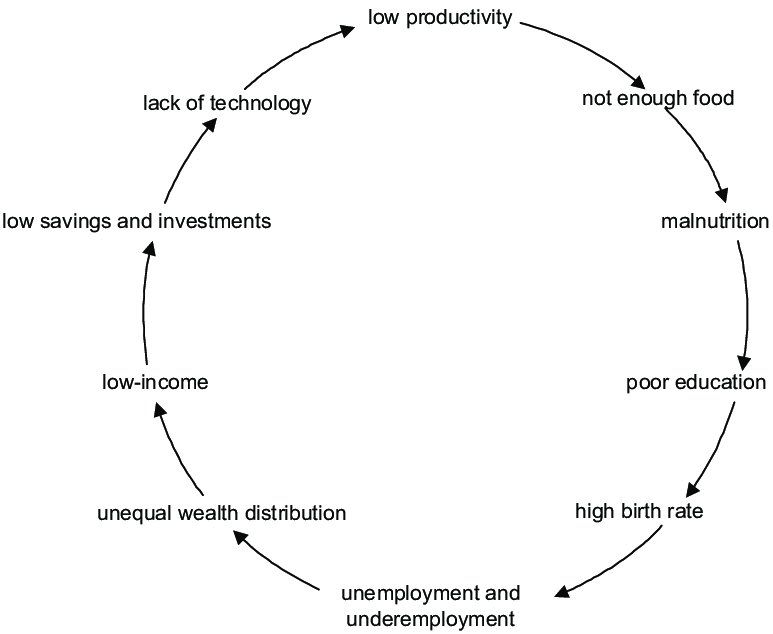
- Lack of Education - Poverty is a vicious cycle and without education, people aren’t able improve their situations. According to UNESCO, over 170 million people could be free of extreme poverty if they only had basic reading skills. UNESCO Global Education Monitoring Report
- Lack of good healthcare - People who are poor are more likely to suffer from bad health, and those with bad health are more likely to be poor. This is because healthcare is often too expensive or inaccessible to those who need it. Without money for medicine and treatment, the poor have to make really tough decisions, and usually essentials like food take priority. People who are sick get sicker, and then they can’t work, which makes the situation even more dire. If people do seek treatment, the cost often ruins their finances. It’s a vicious cycle.
- Warfare/conflict - Eg. Poverty in Iraq, Syria, Afghanistan, etc.
- Weather/climate change - According to the World Bank, climate change has the power to impoverish 100 million people in the next decade or so. We know climate change causes drought, floods, and severe storms, and that can take down successful countries while pulling poor ones down even further. Recovering is extremely difficult, as well, especially for agricultural communities where they barely have enough to feed themselves, let alone prepare for the next harvest year.
- Population Explosion - Increases the demand for consumption goods tremendously.
- Inefficient Resource utilisation - Eg. underemployment and disguised unemployment in the country, particularly in the farming sector.
- Social injustice - Social injustice such as a gender discrimination, racism, or other forms and poverty are direcly correleated. Social injustice lead to Poverty and poverty lead to injustice (vicious cycle). People who are victims of social injustice struggle with getting a good education, the right job opportunities, and access to resources that can lift them out of poverty.
- Low Rate of Economic Development clubbed with inflation.
- Historical factors - Eg. In India, poverty is prevalent due to systmatic loot of Indian resources by Britishers for 150+ years
- Political unwillingness-
- Issues in governance - Problem in implementation of programmes and policies, corruption, etc
Poverty Alleviation Programs in India
- Jawahar Rozgar Yojana/Jawahar Gram Samridhi Yojana: The JRY was meant to generate meaningful employment opportunities for the unemployed and underemployed in rural areas through the creation of economic infrastructure and community and social assets.
- Integrated Rural Development Programme (IRDP): It was aimed at providing assistance to the rural poor in the form of subsidy and bank credit for productive employment opportunities.
- Rural Housing – Indira Awaas Yojana: The Indira Awaas Yojana (LAY) programme aims at providing free housing to Below Poverty Line (BPL) families in rural areas and main targets would be the households of SC/STs.
- Food for Work Programme: It aims at enhancing food security through wage employment. Food grains are supplied to states free of cost, however, the supply of food grains from the Food Corporation of India (FCI) godowns has been slow.
- National Old Age Pension Scheme (NOAPS): This pension is given by the central government. It tries to address the issue of poverty due to old age
- Annapurna Scheme: This scheme was started to provide food to senior citizens who cannot take care of themselves and are not under the National Old Age Pension Scheme (NOAPS), and who have no one to take care of them in their village.
- Pradhan Mantri Kaushal Vikas Yojana: It will focus on fresh entrant to the labour market, especially labour market and class X and XII dropouts.
- Sampoorna Gramin Rozgar Yojana (SGRY): The main objective of the scheme continues to be the generation of wage employment, creation of durable economic infrastructure in rural areas and provision of food and nutrition security for the poor.
- Mahatma Gandhi National Rural Employment Guarantee Act (MGNREGA) 2005: The Act provides 100 days assured employment every year to every rural household. One-third of the proposed jobs would be reserved for women. The central government will also establish National Employment Guarantee Funds. Similarly, state governments will establish State Employment Guarantee Funds for implementation of the scheme. Under the programme, if an applicant is not provided employment within 15 days s/he will be entitled to a daily unemployment allowance.
- National Rural Livelihood Mission: Aajeevika (2011): It evolves out the need to diversify the needs of the rural poor and provide them jobs with regular income on a monthly basis. Self Help groups are formed at the village level to help the needy.**
- National Urban Livelihood Mission: The NULM focuses on organizing urban poor in Self Help Groups, creating opportunities for skill development leading to market-based employment and helping them to set up self-employment ventures by ensuring easy access to credit.
- Pradhan Mantri Jan Dhan Yojana: It aimed at direct benefit transfer of subsidy, pension, insurance etc. and attained the target of opening 1.5 crore bank accounts. The scheme particularly targets the unbanked poor.
Apart from these, various other government schemes tries to deal with poverty alleviation, These include
- Mid day meal scheme
- Integrated Child Development Scheme (ICDS)
- Right to Education Act
- Various pension schemes
etc.
International Indices to measure Poverty
- World Bank defines poverty as deprivation in well-being comprising many dimensions. It includes low incomes and the inability to acquire the basic goods and services necessary for survival with dignity.
- Out of 17 Sustainable Development Goals (SDGs), to which India is committed, the first two are “ending poverty in all forms" and "hunger".
- SDG1 is, by 2030 to reduce at least by half the proportion of men, women and children of all ages living in poverty in all its dimensions according to national definitions. India has not only committed to achieving the Sustainable Development Goals (SDGs), it was a leading proponent of the first goal that addresses the issue of poverty. This goal commits the signatories to eliminating poverty according to the common international poverty line of $1.25 per person per day (at 2005 Purchasing Power Parity or PPP) and cutting it in half “according to national definitions” (goals 1.1 and 1.2, respectively).
- The UN’s 2030 Agenda for Sustainable Development reaffirmed the importance of multi-dimensional approaches to poverty eradication that go beyond economic deprivation.
Various international efforts to measure poverty along with implications for India are briefly discussed below:
Global Multi Dimensional Poverty Index (MPI)
- MPI was developed in 2010 by the Oxford Poverty & Human Development Initiative (OPHI) and the United Nations Development Programme
- It uses different factors to determine poverty beyond income-based lists.
- It replaced the previous Human Poverty Index. The global MPI is released annually by OPHI.
- In Global MPI 2020, India was 62nd among 107 countries with an MPI score of 0.123
- It tracks deprivation across three dimensions and 10 indicators as indicted below:
- Education: Years of schooling and child enrollment
- Health: Child mortality and nutrition
- Standard of living: Electricity, flooring, drinking water, sanitation, cooking fuel and assets
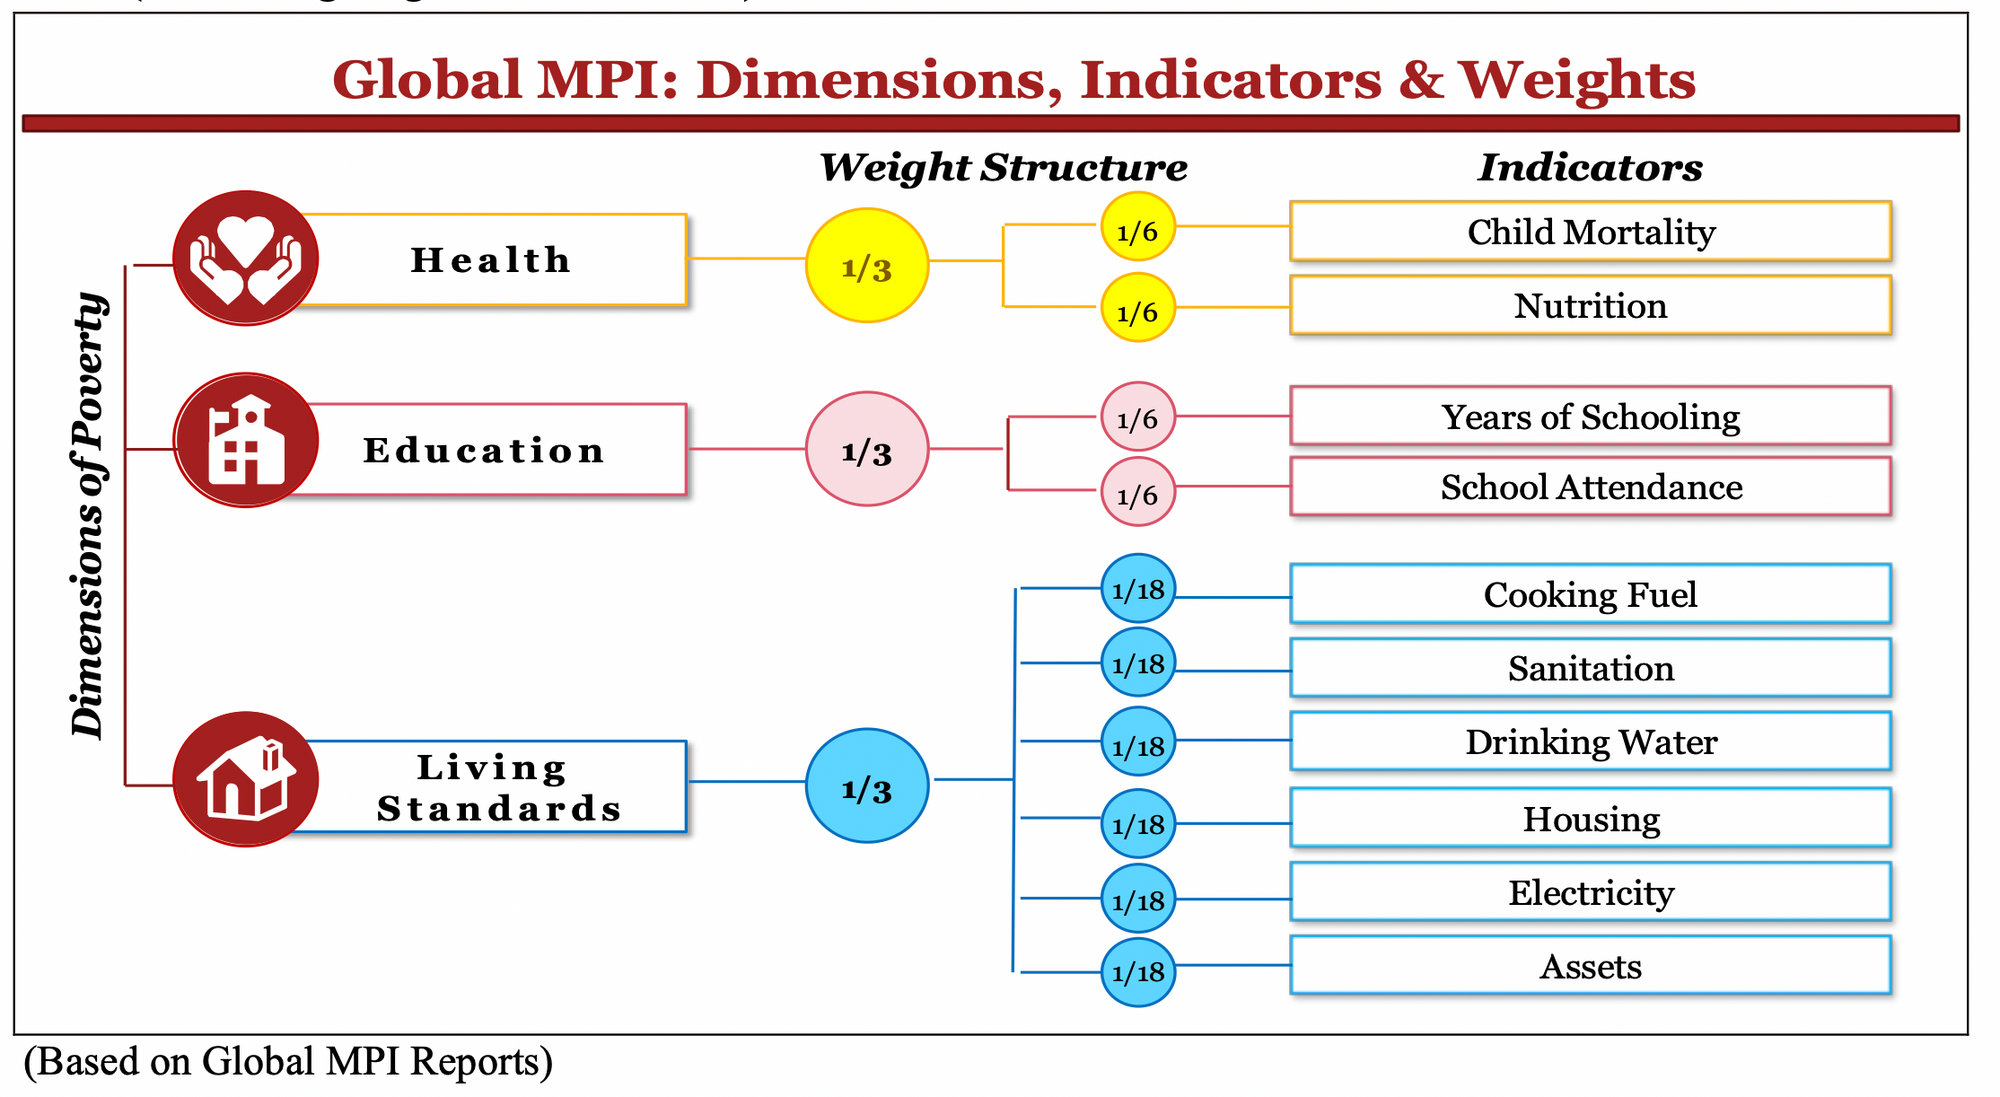
A person is multi-dimensionally poor if she/he is deprived in one third or more (means 33% or more) of the weighted ten indicators. Those who are deprived in one half or more of the weighted indicators are considered living in extreme multidimensional poverty. The MPI ranges from 0 to 1, higher values implying higher poverty
World Bank Poverty Line
- Presently, the World Bank defines extreme poverty as living on less than $1.90 a day, measured in 2011 purchasing power parity prices.
- However, measuring poverty through headcount ratios fails to capture the intensity of poverty – individuals with consumption levels marginally below the poverty line are counted as being poor just as individuals with consumption levels much further below the poverty line.
- World Bank has developed poverty gap index as alternative way of measuring poverty. It measures the intensity of poverty, by calculating the amount of money required by a poor household in order to reach above the poverty line.
World Poverty Clock (WPC)
- WPC is a systematic analytical framework to measure progress towards SDGs by World Data Lab.
- The World Poverty Clock (WPC) provides real-time poverty estimates until 2030 for (almost) every country in the world. The World Poverty Clock (WPC) is a global model that tracks poverty in real time.
- It uses publicly available data on income distribution, production and consumption and bridges the common decadal gaps between large-scale surveys and censuses.
Conclusion
- Despite rapid growth and development, an unacceptably high proportion of our population continues to suffer from severe and multidimensional deprivation. Thus, a more comprehensive and inclusive approach is required to eradicate poverty in India.
For more such posts
Previous Post